IFSIFSFinancial Services · Banks - Regional

IFS Stock Forecast: Intercorp Financial Services, Inc. Price Predictions for 2026-2027

Last close, 21 Aug 2026
$55
+2.01% on the day

The 3 Wall Street analysts covering Intercorp Financial Services, Inc. hold a median 12-month price target of $67 — +22.1% from the last close. Ticker Nerd's systematic factor model, run across ~4,600 US stocks, ranks it 70 of 100 as at 21 Aug 2026 — in the upper half. Here, the model and the Street point the same way.

Market cap
$6.1B
Ticker Nerd rank
70 / 100
Median analyst target
$67
Analysts covering
3
Total return, dividends reinvested
1W
+0.2%
1M
−8.6%
YTD
+34.5%
1Y
+47.5%
From 52W high
−9.7%
From 52W low
+48.0%
$37
$61
52-week range, adjusted closes · the dot is the last close
Ticker Nerd rank

IFS stock analysis: one number for the whole business

Consensus tells you what everyone already believes. The model scores Intercorp Financial Services, Inc. on its factor families — the same systematic rank behind the Ticker Nerd portfolio.

Where the model ranks itAs at 21 Aug 2026
70 / 100

Percentile across ~4,600 US stocks on Ticker Nerd’s systematic factor model. Higher is better. How the model is built and tested

Momentum
80
Issuance
75
Volatility
72
Quality
70
Growth
70
Value
66
Revisions
64
Size
21
Accruals
18

Momentum (80): The shares have been drifting up relative to others.

Accruals (18): A large share of reported profit has not shown up as cash, or the balance sheet is expanding quickly — both tend to unwind.

Built and run by Aslam Ghouse, an ex-Goldman Sachs quant trader with fourteen years in markets.

Wall Street

IFS stock forecast 2026-2027: analyst price targets & predictions

The bullish and bearish analyst opinions on IFS, reported as data — targets and ratings, the market's view beside the model's.

Share price and the analyst range, 12 monthsAdjusted close, US dollars
$30$40$50$60$70$80Oct 25Jan 26Apr 26Jul 26IFSHigh $75Median $67Low $57

Price targets and ratings are third-party analyst estimates, reported here as data. They are not Ticker Nerd forecasts, and they are frequently wrong.

What Wall Street says3 analysts
2 Buy1 Hold0 Sell
Low $57Median $67High $75

The green dot is the last close — the median target sits +22.1% from it.

Recent analyst actionsNewest first
DateFirmActionRatingTarget
15 June 2026JP MorganDowngradeNeutral$56
20 May 2026JP MorganMaintainsOverweight
16 Dec 2025JP MorganMaintainsOverweight
12 Sept 2024JP MorganMaintainsOverweight
16 Apr 2024JP MorganMaintainsOverweight
9 Jan 2024JP MorganMaintainsOverweight
16 Oct 2023JefferiesInitiatesBuy
1 June 2023JP MorganUpgradeOverweight
15 Dec 2022ScotiabankUpgradeSector Outperform
11 Aug 2021JP MorganUpgradeNeutral
20 Apr 2021JP MorganDowngradeUnderweight
20 Jan 2021ScotiabankDowngradeSector Perform
20 Jan 2021ScotiaBankDowngradeSector Perform
12 Nov 2020JP MorganDowngradeNeutral
27 Aug 2020B of A SecuritiesMaintainsBuy
24 June 2020ScotiabankDowngradeSector Perform
24 June 2020ScotiaBankDowngradeSector Perform

Price targets and ratings are third-party analyst estimates, reported here as data. They are not Ticker Nerd forecasts, and they are frequently wrong.

Market Radar

This page is one stock. Monday covers all of them.

Computed off the Friday close and sent before the US open.

Market Radar reports the week’s largest rank changes across roughly 4,600 US stocks, the factor behind each one, and where the market went. IFS appears on the weeks it earns a place.

Free, every Monday. Unsubscribe any time.

Estimates

IFS analyst estimate revisions

Not the forecast itself — the direction analysts are revising it. Revision direction is one of the model's factor families.

Which way the estimates are movingNext fiscal year
EPS revision, 90 days
+2.5%
Analysts raising
0
Analysts cutting
0
Fundamentals

Intercorp Financial Services, Inc. (IFS) financial data

A margin means little on its own. Each bar marks where the figure sits across the whole US universe we score.

Valuation
Trailing P/E
10.0×

Cheaper than 59% of US stocks

Price / sales
1.0×

Cheaper than 69% of US stocks

Price / book
1.6×

Cheaper than 54% of US stocks

EV / EBITDA
Growth & margins
Revenue growth (YoY)
3.8%

Higher than 36% of US stocks

Earnings growth (YoY)
0.9%

Higher than 36% of US stocks

Gross margin
Operating margin
44.7%

Higher than 94% of US stocks

Net margin
35.7%

Higher than 93% of US stocks

Returns & dividend
Return on equity
17.2%

Higher than 78% of US stocks

Return on assets
2.1%

Higher than 59% of US stocks

Dividend yield
13.1%

Higher than 93% of US dividend payers

Bars mark the percentile across the ~4,600 US stocks Ticker Nerd covers, among those reporting the figure.

Peers

IFS vs competitors

The nearest names by industry and size, scored by the same model — like for like.

Its peer group, ranked by the same modelBanks - Regional
CompanyMarket capTKN rank
IFSIntercorp Financial Services, Inc.$6.1B
70
GBCIGlacier Bancorp, Inc.$6.1B
27
HOMBHome Bancshares, Inc. (Arkansas)$6.1B
66
FNBF.N.B. Corp. (Pennsylvania)$6.6B
55
UBSIUnited Bankshares, Inc. (West Virginia)$6.7B
85
HWCHancock Whitney Corp.$6.0B
49
AUBAtlantic Union Bankshares Corp.$5.9B
57

Look up any of the roughly 4,600 stocks we score.

The rank is the raw material. Whether the rules would actually own Intercorp Financial Services, Inc. — and when they’d sell — is the membership. See the Ticker Nerd 20 →

News

Latest IFS news & analysis

IFS vs. AXP: Which Stock Should Value Investors Buy Now?

Zacks Investment Research · 21 Aug 2026neutral

Zacks Investment Research published a comparison of Intercorp Financial Services (IFS) and American Express (AXP), examining which of the two Financial - Miscellaneous Services stocks offers the better value opportunity for investors at this time.

Why it matters — The article positions IFS as a value candidate in direct comparison with a major industry peer, which could influence how investors assess its relative valuation.

Intercorp Financial Services: Strong Profitability At A Discount

Seeking Alpha · 14 Aug 2026positive

A Seeking Alpha article highlights Intercorp Financial Services' strong capital efficiency, citing an 18.5% Q2 return on equity and a diversified business across banking, insurance, and asset management. Despite robust profitability and double-digit profit growth, the stock trades at a discount, with Interbank as the primary profit driver while Interseguro's net income surged 46.8% and payment ecosystem transactions grew 44%.

Why it matters — IFS watchers would note that the company's broad-based growth across banking, insurance, and payments supports its profitability, while its discounted valuation reflects Peru-specific risks.

Should Value Investors Buy Intercorp Financial Services (IFS) Stock?

Zacks Investment Research · 13 Aug 2026neutral

Zacks Investment Research published an article examining whether Intercorp Financial Services (IFS) stock is suitable for value investors, highlighting the Zacks Rank system's focus on earnings estimates and revisions.

Why it matters — The article signals that IFS is being evaluated through a value-investing lens by a major research firm, which could influence investor attention on the stock.

Intercorp Financial Services Inc. (IFS) Q2 2026 Earnings Call Transcript

Seeking Alpha · 13 Aug 2026neutral

Intercorp Financial Services, Inc. (IFS) released the transcript of its Q2 2026 earnings call, covering the company's second-quarter financial results and management discussion.

Why it matters — IFS watchers would review this transcript for the company's latest quarterly financial performance and management commentary.

Intercorp Financial Services Q2 Earnings Call Highlights

MarketBeat · 12 Aug 2026positive

Intercorp Financial Services reported second-quarter 2026 net income of PEN 585 million and return on equity of 18.5%. Management cited continued growth in higher-yielding loans, insurance premiums, and wealth-management assets as drivers.

Why it matters — This update provides a key indicator of IFS's recent financial performance and the growth areas management is focusing on.

FAQ

Frequently asked questions about IFS stock

What is the IFS stock price forecast for 2026-2027?

The 3 Wall Street analysts covering Intercorp Financial Services, Inc. have a median 12-month price target of $67, with estimates ranging from $57 to $75. These are third-party analyst estimates, not Ticker Nerd forecasts, and they are frequently wrong.

Is IFS stock a buy right now?

Of the 3 analysts covering Intercorp Financial Services, Inc., 2 rate it a Buy, 1 a Hold and 0 a Sell. Ticker Nerd's systematic factor model ranks Intercorp Financial Services, Inc. 70 out of 100 across roughly 4,600 US stocks as at 21 Aug 2026. None of this is personal advice — it does not consider your circumstances.

How does Ticker Nerd's model rank IFS?

As at 21 Aug 2026, Intercorp Financial Services, Inc. ranks 70 out of 100 on Ticker Nerd's systematic factor model — a percentile across roughly 4,600 US stocks, built from its factor families. Its strongest factor family is Momentum (80 of 100).

Will IFS stock go up?

No one can know that. What the data says: the median 12-month target from 3 analysts implies +22.1% from the last close, and Ticker Nerd's factor model ranks Intercorp Financial Services, Inc. 70 out of 100 as at 21 Aug 2026. Analyst targets are third-party estimates and frequently wrong; none of this is personal advice.

What is the IFS stock forecast for 2030?

No analyst covering Intercorp Financial Services, Inc. publishes a 2030 price target — Wall Street targets run 12 to 18 months out. Sites quoting a 2030 price for IFS are extrapolating price history, which says nothing about the business. The furthest attributed numbers are the current analyst targets: $57 to $75 over the next 12 months.

How has IFS stock performed over the past year?

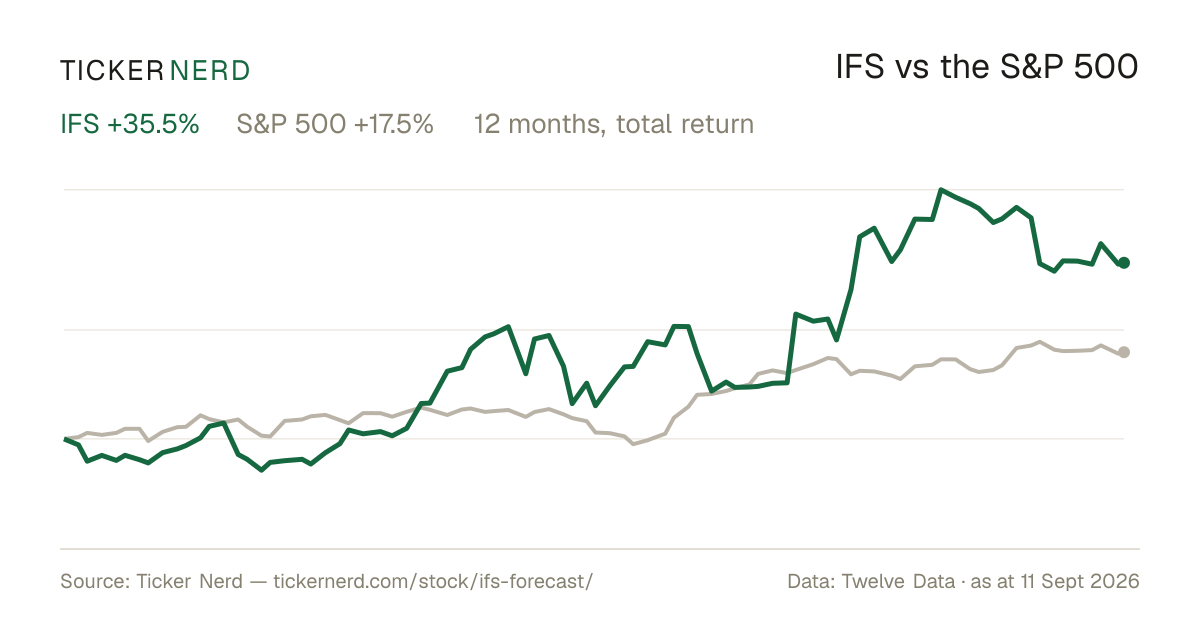
Intercorp Financial Services, Inc. returned +47.5% over the 12 months to 21 Aug 2026, with dividends reinvested. Past performance does not indicate future returns.

What does Intercorp Financial Services, Inc. do?

Intercorp Financial Services Inc. is a financial holding company based in Peru, primarily focused on providing a diverse range of financial products and services.

What is the latest news on IFS?

The most recent item we track (Zacks Investment Research, 21 Aug 2026): "IFS vs. AXP: Which Stock Should Value Investors Buy Now?". Zacks Investment Research published a comparison of Intercorp Financial Services (IFS) and American Express (AXP), examining which of the two Financial - Miscellaneous Services stocks offers the better value opportunity for investors at this time.

Company

About Intercorp Financial Services, Inc.

Intercorp Financial Services Inc. is a financial holding company based in Peru, primarily focused on providing a diverse range of financial products and services. The company's core mission is to enhance financial accessibility in the Peruvian market through its subsidiaries, including Interbank, Interseguro, and Inteligo Group. Interbank focuses on catering to retail banking customers, offering solutions such as savings accounts, loans, and credit cards. Interseguro provides life insurance and annuity products, aiming to protect individuals and their families against financial uncertainties. Inteligo Group specializes in wealth management and brokerage services, addressing the needs of high-net-worth individuals and institutional investors. Intercorp Financial Services Inc. plays a pivotal role in the Peruvian financial landscape by promoting economic growth and fostering financial inclusion across the nation. Its strategic alignment with the broader Intercorp Group allows it to leverage synergies across different sectors, significantly impacting areas such as consumer finance, insurance, and investment services. By contributing to the development of a robust financial infrastructure, Intercorp Financial Services Inc. serves as a key player in modernizing and expanding financial services in Peru.

CEO Lord Luis Felipe Castellanos Lopez-Torres B.B.A. · 9,229 employees · Peru · https://ifs.com.pe