KINSKINSFinancial Services · Insurance - Property & Casualty

KINS Stock Forecast: Kingstone Cos., Inc. Price Predictions for 2026-2027

Last close, 3 Aug 2026
$20
+0.95% on the day

The 1 Wall Street analysts covering Kingstone Cos., Inc. hold a median 12-month price target of $22 — +6.6% from the last close. Ticker Nerd's systematic factor model, run across ~4,600 US stocks, ranks it 82 of 100 as at 1 Aug 2026 — inside the top quartile. Here, the model and the Street point the same way.

Market cap
$289.3M
Ticker Nerd rank
82 / 100
Median analyst target
$22
Analysts covering
1
Total return, dividends reinvested
1W
+2.5%
1M
+0.2%
YTD
+20.5%
1Y
+32.5%
From 52W high
−2.3%
From 52W low
+54.1%
$13
$21
52-week range, adjusted closes · the dot is the last close
Ticker Nerd rank

KINS stock analysis: one number for the whole business

Consensus tells you what everyone already believes. The model scores Kingstone Cos., Inc. on its factor families — the same systematic rank behind the Ticker Nerd portfolio.

Where the model ranks itAs at 1 Aug 2026
82 / 100

Percentile across ~4,600 US stocks on Ticker Nerd’s systematic factor model. Higher is better. How the model is built and tested

Quality
96
Revisions
87
Momentum
83
Growth
81
Size
62
Value
53
Issuance
48
Volatility
16
Accruals
14

Quality (96): The business earns solid, repeatable profits on what it owns.

Accruals (14): A large share of reported profit has not shown up as cash, or the balance sheet is expanding quickly — both tend to unwind.

The rank is the raw material. Whether the rules would actually own Kingstone Cos., Inc. — and when they’d sell — is the membership.

Wall Street

KINS stock forecast 2026-2027: analyst price targets & predictions

The bullish and bearish analyst opinions on KINS, reported as data — targets and ratings, the market's view beside the model's.

Share price and the analyst range, 12 monthsAdjusted close, US dollars
$12$14$16$18$20$22Oct 25Jan 26Apr 26Jul 26KINSHigh $22Median $22Low $22

Price targets and ratings are third-party analyst estimates, reported here as data. They are not Ticker Nerd forecasts, and they are frequently wrong.

What Wall Street says1 analysts
1 Buy0 Hold0 Sell
Low $22Median $22High $22

The green dot is the last close — the median target sits +6.6% from it.

Recent analyst actionsNewest first
DateFirmActionRatingTarget
16 July 2024Janney Montgomery ScottInitiatesBuy$6.50
16 July 2024Janney Montgomery ScottInitiatesBuy
20 Nov 2023Piper SandlerDowngradeUnderweight
13 Feb 2023Piper SandlerDowngradeNeutral
16 May 2022Piper SandlerMaintainsOverweight
12 Nov 2021Boenning & ScattergoodDowngradeNeutral
6 Apr 2020Piper SandlerMaintainsOverweight
2 Apr 2014Compass PointMaintainsBuy
20 Dec 2013Piper SandlerInitiatesBuy
20 Dec 2013Sandler O'NeillInitiatesBuy

Price targets and ratings are third-party analyst estimates, reported here as data. They are not Ticker Nerd forecasts, and they are frequently wrong.

Estimates

KINS analyst estimate revisions

Not the forecast itself — the direction analysts are revising it. Revision direction is one of the model's factor families.

Which way the estimates are movingNext fiscal year
Analysts raising
1
Analysts cutting
0
Fundamentals

Kingstone Cos., Inc. (KINS) financial data

A margin means little on its own. Each bar marks where the figure sits across the whole US universe we score.

Valuation
Trailing P/E
9.1×

Cheaper than 61% of US stocks

Price / sales
1.3×

Cheaper than 64% of US stocks

Price / book
2.5×

Cheaper than 38% of US stocks

EV / EBITDA
6.7×

Cheaper than 49% of US stocks

Growth & margins
Revenue growth (YoY)
23.2%

Higher than 75% of US stocks

Earnings growth (YoY)
18.4%

Higher than 60% of US stocks

Gross margin
Operating margin
−12.3%

Higher than 25% of US stocks

Net margin
13.9%

Higher than 76% of US stocks

Returns & dividend
Return on equity
31.6%

Higher than 89% of US stocks

Return on assets
5.8%

Higher than 81% of US stocks

Dividend yield
0.6%

Higher than 12% of US dividend payers

Bars mark the percentile across the ~4,600 US stocks Ticker Nerd covers, among those reporting the figure.

Peers

KINS vs competitors

The nearest names by industry and size, scored by the same model — like for like.

Its peer group, ranked by the same modelInsurance - Property & Casualty
CompanyMarket capTKN rank
KINSKingstone Cos., Inc.$289.3M
82
NODKNI Holdings, Inc.$310.9M
47
GBLIGlobal Indemnity Group LLC$394.6M
72
AIIAmerican Integrity Insurance Group, Inc.$397.3M
27
ACICAmerican Coastal Insurance Corp.$517.9M
86
DGICADonegal Group, Inc.$770.6M
63
HIPOHippo Holdings, Inc.$829.9M
57
Market Radar

This page is one stock. Monday covers all of them.

Computed off the Friday close and sent before the US open.

Market Radar reports the week’s largest rank changes across roughly 4,600 US stocks, the factor behind each one, and where the market went. KINS appears on the weeks it earns a place.

Free, every Monday. Unsubscribe any time.

FAQ

Frequently asked questions about KINS stock

What is the KINS stock price forecast for 2026-2027?

The 1 Wall Street analysts covering Kingstone Cos., Inc. have a median 12-month price target of $22, with estimates ranging from $22 to $22. These are third-party analyst estimates, not Ticker Nerd forecasts, and they are frequently wrong.

Is KINS stock a buy right now?

Of the 1 analysts covering Kingstone Cos., Inc., 1 rate it a Buy, 0 a Hold and 0 a Sell. Ticker Nerd's systematic factor model ranks Kingstone Cos., Inc. 82 out of 100 across roughly 4,600 US stocks as at 1 Aug 2026. None of this is personal advice — it does not consider your circumstances.

How does Ticker Nerd's model rank KINS?

As at 1 Aug 2026, Kingstone Cos., Inc. ranks 82 out of 100 on Ticker Nerd's systematic factor model — a percentile across roughly 4,600 US stocks, built from its factor families. Its strongest factor family is Quality (96 of 100).

Will KINS stock go up?

No one can know that. What the data says: the median 12-month target from 1 analysts implies +6.6% from the last close, and Ticker Nerd's factor model ranks Kingstone Cos., Inc. 82 out of 100 as at 1 Aug 2026. Analyst targets are third-party estimates and frequently wrong; none of this is personal advice.

What is the KINS stock forecast for 2030?

No analyst covering Kingstone Cos., Inc. publishes a 2030 price target — Wall Street targets run 12 to 18 months out. Sites quoting a 2030 price for KINS are extrapolating price history, which says nothing about the business. The furthest attributed numbers are the current analyst targets: $22 to $22 over the next 12 months.

How has KINS stock performed over the past year?

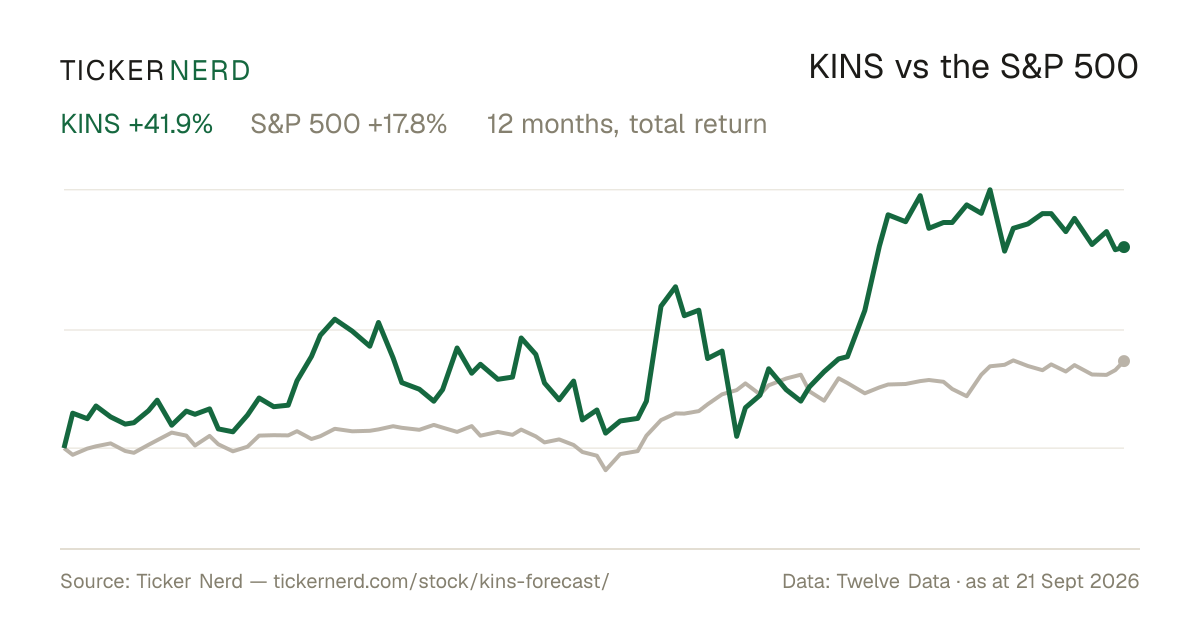
Kingstone Cos., Inc. returned +32.5% over the 12 months to 3 Aug 2026, with dividends reinvested. Past performance does not indicate future returns.

What does Kingstone Cos., Inc. do?

Kingstone Companies Inc. is a property and casualty insurance holding company.

Company

About Kingstone Cos., Inc.

Kingstone Companies Inc. is a property and casualty insurance holding company. The primary function of Kingstone Companies Inc. is to provide coverage for personal lines such as homeowners, multi-peril, and commercial automobile insurance. The company's insurance products serve both individual and commercial clients, ensuring financial protection against various risks and liabilities. A distinguishing feature of Kingstone is its focus on niche markets, particularly within the Northeastern United States, which allows for specialized service offerings tailored to regional customer needs. Headquartered in Kingston, New York, the company's strategic approach involves underwriting discipline and agile claims management, aiming to offer comprehensive and customer-oriented insurance solutions. In the financial market, Kingstone plays a significant role by supporting economic stability and risk management in its operating regions, contributing to the overall health of the insurance sector by adapting to regulatory changes and evolving market conditions.

CEO Ms. Meryl S. Golden · 113 employees · United States · https://www.kingstonecompanies.com