PAXPAXFinancial Services · Asset Management

PAX Stock Forecast: Patria Investments Ltd. Price Predictions for 2026-2027

Last close, 9 Oct 2026
$12
+3.64% on the day

The 6 Wall Street analysts covering Patria Investments Ltd. hold a median 12-month price target of $15 — +28.5% from the last close. Ticker Nerd's systematic factor model, run across ~4,600 US stocks, ranks it 42 of 100 as at 8 Oct 2026 — in the lower half.

Market cap
$1.8B
Ticker Nerd rank
42 / 100
Median analyst target
$15
Analysts covering
6
Revenue$97.1M+22.0% y/y
Operating income$31.7M
Net income$4.6M
Free cash flow$27.3M
Quarterly, 8 quarters to 31 Mar 2026 · latest quarter's figure shown
Total return, dividends reinvested
1W
+14.3%
1M
+7.9%
YTD
−23.7%
1Y
−12.7%
From 52W high
−31.1%
From 52W low
+16.7%
$10
$17
52-week range, adjusted closes · the dot is the last close
Ticker Nerd rank

PAX stock analysis: one number for the whole business

Consensus tells you what everyone already believes. The model scores Patria Investments Ltd. on its factor families — the same systematic rank behind the Ticker Nerd portfolio.

Where the model ranks itAs at 8 Oct 2026
42 / 100

Percentile across ~4,600 US stocks on Ticker Nerd’s systematic factor model. Higher is better. How the model is built and tested

Volatility
82
Quality
77
Value
76
Revisions
58
Growth
51
Momentum
37
Size
36
Issuance
22
Accruals
12

Volatility (82): The share price has been relatively steady.

Accruals (12): A large share of reported profit has not shown up as cash, or the balance sheet is expanding quickly — both tend to unwind.

Built and run by Aslam Ghouse, an ex-Goldman Sachs quant trader with fourteen years in markets.

Wall Street

PAX stock forecast 2026-2027: analyst price targets & predictions

The bullish and bearish analyst opinions on PAX, reported as data — targets and ratings, the market's view beside the model's.

Share price and the analyst range, 12 monthsAdjusted close, US dollars
$8$10$12$14$16$18$20Jan 26Apr 26Jul 26Oct 26PAXHigh $20Median $15Low $9

Price targets and ratings are third-party analyst estimates, reported here as data. They are not Ticker Nerd forecasts, and they are frequently wrong.

Data provided by Twelve Data

What Wall Street says6 analysts
3 Buy2 Hold1 Sell
Low $9Median $15High $20

The green dot is the last close — the median target sits +28.5% from it.

Recent analyst actionsNewest first
DateFirmActionRatingTarget
10 Sept 2026JP MorganMaintainsNeutral$15 → $13
8 Apr 2026JP MorganMaintainsNeutral—
8 Apr 2026JP MorganMaintainsNeutral$17 → $16
28 Jan 2026Goldman SachsMaintainsBuy—
22 Oct 2024Goldman SachsMaintainsBuy—
14 June 2023JP MorganMaintainsNeutral—
18 Apr 2023Keefe, Bruyette & WoodsMaintainsOutperform—
5 Apr 2023B of A SecuritiesMaintainsNeutral—
15 Feb 2023Goldman SachsMaintainsBuy—
15 Feb 2023Keefe, Bruyette & WoodsMaintainsOutperform—
7 Sept 2022B of A SecuritiesReinstatesNeutral$17
14 Dec 2021Goldman SachsMaintainsBuy—
21 May 2021Credit SuisseMaintainsOutperform—
21 May 2021Itau BBAInitiatesOutperform—
17 Feb 2021Goldman SachsInitiatesBuy—

Price targets and ratings are third-party analyst estimates, reported here as data. They are not Ticker Nerd forecasts, and they are frequently wrong.

Market Radar

This page is one stock. Monday covers all of them.

Computed off the Friday close and sent before the US open.

Market Radar reports the week’s largest rank changes across roughly 4,600 US stocks, the factor behind each one, and where the market went. PAX appears on the weeks it earns a place.

Free, every Monday. Unsubscribe any time.

Performance

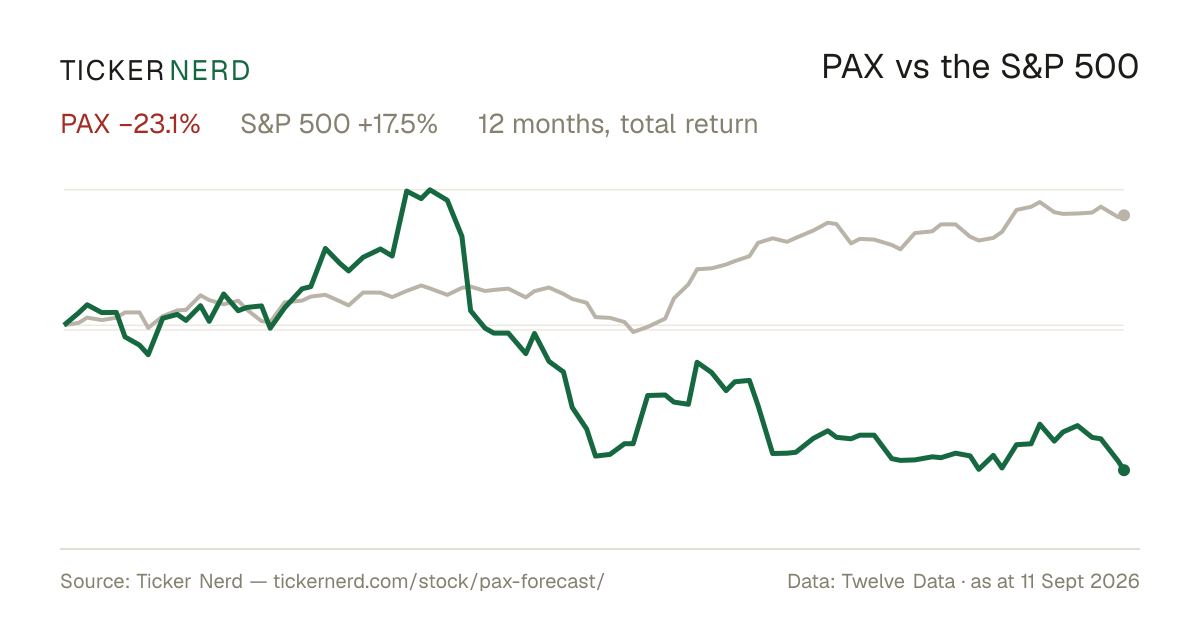
PAX vs the S&P 500

Both lines are total return — dividends reinvested — so the comparison is honest on both sides.

Over the twelve months to 9 Oct 2026, Patria Investments Ltd. returned −12.7% against +17.3% for the S&P 500, dividends included.

PAX vs S&P 500, last 12 monthsTotal return, rebased to 100
708090100110120130Jan 26Apr 26Jul 26Oct 26PAXS&P 500

Download this chart as an image — free to reuse; link this page as the source.

Data provided by Twelve Data

Estimates

PAX analyst estimate revisions

Not the forecast itself — the direction analysts are revising it. Revision direction is one of the model's factor families.

Which way the estimates are movingNext fiscal year
EPS revision, 90 days
−0.6%
Analysts raising
0
Analysts cutting
1
Fundamentals

Patria Investments Ltd. (PAX) financial data

A margin means little on its own. Each bar marks where the figure sits across the whole US universe we score.

Valuation
Trailing P/E
25.3×

Cheaper than 30% of US stocks

Price / sales
4.3×

Cheaper than 28% of US stocks

Price / book
3.2×

Cheaper than 30% of US stocks

EV / EBITDA
11.2×

Cheaper than 33% of US stocks

Growth & margins
Revenue growth (YoY)
34.9%

Higher than 80% of US stocks

Earnings growth (YoY)
−18.3%

Higher than 21% of US stocks

Gross margin
80.5%

Higher than 91% of US stocks

Operating margin
22.6%

Higher than 82% of US stocks

Net margin
16.3%

Higher than 79% of US stocks

Returns & dividend
Return on equity
12.9%

Higher than 70% of US stocks

Return on assets
5.6%

Higher than 79% of US stocks

Dividend yield
5.8%

Higher than 94% of US dividend payers

Bars mark the percentile across the ~4,600 US stocks Ticker Nerd covers, among those reporting the figure.

Key statistics

Patria Investments Ltd. (PAX) statistics: revenue, profit & scale

The headline figures, each with its date. Every row carries its own link — cite it straight from here.

  • Patria Investments Ltd. has a market value of $1.8B and an enterprise value of $2.0B.

  • Revenue in the twelve months to 31 Mar 2026: $399.2M. The latest quarter grew 34.9% year on year.

  • Net income over the same four quarters: $78.6M, a 19.7% net margin.

  • Free cash flow in the twelve months to 31 Mar 2026: $182.8M, after $11.4M of capital spending.

  • Patria Investments Ltd. spent $68.9M on share buybacks and $95.6M on dividends in the twelve months to 31 Mar 2026.

  • Shares outstanding: 161.4M.

  • Trailing P/E: 25.3×; forward P/E: 7.7× — the forward figure prices analyst consensus estimates, not reported earnings.

  • Forward dividend yield: 5.85%, paying out 135% of earnings.

  • Patria Investments Ltd. employs 548 people — $729K of revenue per employee.

Statement figures: company filings via Twelve Data, four quarters to 31 Mar 2026 · market figures as at 8 Oct 2026

Data provided by Twelve Data

Peers

PAX vs competitors

The nearest names by industry and size, scored by the same model — like for like.

Its peer group, ranked by the same modelAsset Management
CompanyMarket capTKN rank
PAXPatria Investments Ltd.$1.8B
42
GCMGGCM Grosvenor, Inc.$2.6B
89
APAMArtisan Partners Asset Management, Inc.$2.7B
71
MSDLMorgan Stanley Direct Lending Fund$1.2B
70
ASSTStrive, Inc. (United States)$2.9B
23
DBRGDigitalBridge Group, Inc.$2.9B
—
AAMIAcadian Asset Management, Inc.$3.3B
95

Look up any of the roughly 4,600 stocks we score.

The rank is the raw material. Whether the rules would actually own Patria Investments Ltd. — and when they’d sell — is the membership. See the Ticker Nerd 20 →

News

Latest PAX news & analysis

Buy 19 September LoPrice/HiYield Dividend Dogs Out Of 38

Seeking Alpha · 30 Sept 2026neutral

The article discusses the investment appeal of low-priced, high-yield dividend stocks, or "Dividend Dogs," arguing they are currently undervalued relative to growth stocks. It notes analyst projections for the top ten such stocks suggest significant upside by September 2027, while also flagging that fourteen of thirty-eight highlighted stocks rely on borrowed funds for their payouts, posing higher risk.

Why it matters — A PAX watcher would care because dividend-yield dynamics and stock valuations in the broader market can inform context around PAX's own positioning and shareholder returns.

18 Ideal "Safer" DiviDog Buys Readers Tagged In August

Seeking Alpha · 24 Sept 2026neutral

The article presents the August ReFa/Ro Dog list of high-yield dividend stocks, noting all top ten pass the IDEAL test but that brokers forecast wide net gain ranges and significant negative free cash flow margins among the picks, indicating elevated dividend risk.

Why it matters — PAX watchers would care because the piece highlights dividend sustainability scrutiny and risk assessment applied to high-yield income strategies relevant to Patria's dividend-focused investors.

25 Dividend Buys You May Want To Hold Forever From September's Russell Index

Seeking Alpha · 16 Sept 2026neutral

A Seeking Alpha article highlights top dividend-yielding stocks ("dividend dogs") from September's Russell Index, forecasting average net gains of 40.06% by September 2027 and noting that fifteen of fifty-one so-called SML Russell MHFS stocks have negative free cash flow margins, making their dividends riskier.

Why it matters — PAX watchers would care because dividend-screening articles and free cash flow scrutiny across Russell Index constituents can influence how income-focused investors evaluate dividend issuers like Patria Investments.

Patria Investments (PAX) Upgraded to Buy: Here's What You Should Know

Zacks Investment Research · 8 Sept 2026positive

Zacks Investment Research upgraded Patria Investments (PAX) to a Zacks Rank #2 (Buy), reflecting growing optimism about the company's earnings prospects. The upgrade could drive the stock higher in the near term.

Why it matters — This upgrade signals improved expectations about PAX's earnings outlook, which may influence investor sentiment and near-term stock performance.

PAX vs. KKR: Which Stock Is the Better Value Option?

Zacks Investment Research · 8 Sept 2026neutral

Zacks Investment Research published a comparison of Patria Investments (PAX) and KKR & Co. Inc. (KKR), two stocks in the Financial - Investment Management sector, examining which presents the better value opportunity for investors at this time.

Why it matters — Patria watchers would be interested in how their company's value metrics stack up against a major industry peer like KKR.

FAQ

Frequently asked questions about PAX stock

What is the PAX stock price forecast for 2026-2027?

The 6 Wall Street analysts covering Patria Investments Ltd. have a median 12-month price target of $15, with estimates ranging from $9 to $20. These are third-party analyst estimates, not Ticker Nerd forecasts, and they are frequently wrong.

Is PAX stock a buy right now?

Of the 6 analysts covering Patria Investments Ltd., 3 rate it a Buy, 2 a Hold and 1 a Sell. Ticker Nerd's systematic factor model ranks Patria Investments Ltd. 42 out of 100 across roughly 4,600 US stocks as at 8 Oct 2026. None of this is personal advice — it does not consider your circumstances.

How does Ticker Nerd's model rank PAX?

As at 8 Oct 2026, Patria Investments Ltd. ranks 42 out of 100 on Ticker Nerd's systematic factor model — a percentile across roughly 4,600 US stocks, built from its factor families. Its strongest factor family is Volatility (82 of 100).

Will PAX stock go up?

No one can know that. What the data says: the median 12-month target from 6 analysts implies +28.5% from the last close, and Ticker Nerd's factor model ranks Patria Investments Ltd. 42 out of 100 as at 8 Oct 2026. Analyst targets are third-party estimates and frequently wrong; none of this is personal advice.

What is the PAX stock forecast for 2030?

No analyst covering Patria Investments Ltd. publishes a 2030 price target — Wall Street targets run 12 to 18 months out. Sites quoting a 2030 price for PAX are extrapolating price history, which says nothing about the business. The furthest attributed numbers are the current analyst targets: $9 to $20 over the next 12 months.

How has PAX stock performed over the past year?

Patria Investments Ltd. returned -12.7% over the 12 months to 9 Oct 2026, with dividends reinvested. Past performance does not indicate future returns.

What does Patria Investments Ltd. do?

Patria Investments Limited Class A Common Shares represent equity in Patria Investments Limited, a global alternative asset management firm. Patria Investments Limited focuses on managing private equity, infrastructure, real estate, and credit strategies, serving institutional clients and investors across multiple markets.

What is the latest news on PAX?

The most recent item we track (Seeking Alpha, 30 Sept 2026): "Buy 19 September LoPrice/HiYield Dividend Dogs Out Of 38". The article discusses the investment appeal of low-priced, high-yield dividend stocks, or "Dividend Dogs," arguing they are currently undervalued relative to growth stocks. It notes analyst projections for the top ten such stocks suggest significant upside by September 2027, while also flagging that fourteen of thirty-eight highlighted stocks rely on borrowed funds for their payouts, posing higher risk.

Company

About Patria Investments Ltd.

Patria Investments Limited Class A Common Shares represent equity in Patria Investments Limited, a global alternative asset management firm. Patria Investments Limited focuses on managing private equity, infrastructure, real estate, and credit strategies, serving institutional clients and investors across multiple markets. The company operates as an asset manager that allocates capital, structures investment vehicles, and provides exposure to private market opportunities through a range of funds and mandates. Its business spans investment origination, portfolio management, and advisory services, with activities centered on private markets and alternative assets. Patria Investments Limited Class A Common Shares provide investors with ownership in a company whose core role is to connect capital with specialized investment strategies in sectors that are often less accessible through traditional public market instruments.

CEO Mr. Alexandre Teixeira de Assumpcao Saigh · 548 employees · United States · https://www.patria.com