ROSTROSTConsumer Cyclical · Apparel Retail

ROST Stock Forecast: Ross Stores, Inc. Price Predictions for 2026-2027

Last close, 21 Aug 2026
$239
+4.39% on the day

The 20 Wall Street analysts covering Ross Stores, Inc. hold a median 12-month price target of $283 — +18.2% from the last close. Ticker Nerd's systematic factor model, run across ~4,600 US stocks, ranks it 93 of 100 as at 22 Aug 2026 — among the strongest tenth. Here, the model and the Street point the same way.

Market cap
$76.7B
Ticker Nerd rank
93 / 100
Median analyst target
$283
Analysts covering
20
Total return, dividends reinvested
1W
−2.6%
1M
+1.4%
YTD
+33.2%
1Y
+65.6%
From 52W high
−6.3%
From 52W low
+66.3%
$144
$255
52-week range, adjusted closes · the dot is the last close
Ticker Nerd rank

ROST stock analysis: one number for the whole business

Consensus tells you what everyone already believes. The model scores Ross Stores, Inc. on its factor families — the same systematic rank behind the Ticker Nerd portfolio.

Where the model ranks itAs at 22 Aug 2026
93 / 100

Percentile across ~4,600 US stocks on Ticker Nerd’s systematic factor model. Higher is better. How the model is built and tested

Revisions
95
Issuance
94
Momentum
94
Growth
86
Quality
85
Volatility
82
Accruals
44
Value
36
Size
4

Revisions (95): Analysts have, on balance, been raising their forecasts.

Value (36): The shares cost a lot relative to the profits and assets behind them.

Size (4): Larger than most of the companies we track — more scrutinised, less often mispriced.

Built and run by Aslam Ghouse, an ex-Goldman Sachs quant trader with fourteen years in markets.

Wall Street

ROST stock forecast 2026-2027: analyst price targets & predictions

The bullish and bearish analyst opinions on ROST, reported as data — targets and ratings, the market's view beside the model's.

Share price and the analyst range, 12 monthsAdjusted close, US dollars
$150$200$250$300Oct 25Jan 26Apr 26Jul 26ROSTHigh $310Median $283Low $176

Price targets and ratings are third-party analyst estimates, reported here as data. They are not Ticker Nerd forecasts, and they are frequently wrong.

What Wall Street says20 analysts
14 Buy5 Hold1 Sell
Low $176Median $283High $310

The green dot is the last close — the median target sits +18.2% from it.

Recent analyst actionsNewest first

Of the 20 most recent actions, 13 moved their price target up and 0 moved it down.

DateFirmActionRatingTarget
21 Aug 2026BairdMaintainsOutperform$250$270
21 Aug 2026BarclaysMaintainsOverweight$260$298
21 Aug 2026BernsteinMaintainsMarket Perform$230$240
21 Aug 2026CitigroupMaintainsBuy$270$290
21 Aug 2026Evercore ISI GroupMaintainsOutperform$276$290
21 Aug 2026JefferiesMaintainsBuy$265$285
21 Aug 2026JP MorganMaintainsOverweight$262$272
21 Aug 2026Morgan StanleyMaintainsEqual-Weight$231$234
21 Aug 2026Truist SecuritiesMaintainsBuy$290$310
21 Aug 2026UBSMaintainsNeutral$232$239
21 Aug 2026Wells FargoMaintainsEqual-Weight$245$248
17 Aug 2026Evercore ISI GroupMaintainsOutperform$265$276
14 Aug 2026Telsey Advisory GroupMaintainsOutperform$265$280
23 June 2026Wells FargoDowngradeEqual-Weight
23 June 2026Wells FargoDowngradeEqual-Weight$245
26 May 2026BarclaysMaintainsOverweight
22 May 2026CitigroupMaintainsBuy
22 May 2026Telsey Advisory GroupMaintainsOutperform
22 May 2026Truist SecuritiesMaintainsBuy
22 May 2026UBSMaintainsNeutral

Price targets and ratings are third-party analyst estimates, reported here as data. They are not Ticker Nerd forecasts, and they are frequently wrong.

Market Radar

This page is one stock. Monday covers all of them.

Computed off the Friday close and sent before the US open.

Market Radar reports the week’s largest rank changes across roughly 4,600 US stocks, the factor behind each one, and where the market went. ROST appears on the weeks it earns a place.

Free, every Monday. Unsubscribe any time.

Estimates

ROST analyst estimate revisions

Not the forecast itself — the direction analysts are revising it. Revision direction is one of the model's factor families.

Which way the estimates are movingNext fiscal year
EPS revision, 90 days
+5.7%
Analysts raising
1
Analysts cutting
0
Fundamentals

Ross Stores, Inc. (ROST) financial data

A margin means little on its own. Each bar marks where the figure sits across the whole US universe we score.

Valuation
Trailing P/E
28.9×

Cheaper than 27% of US stocks

Price / sales
3.1×

Cheaper than 39% of US stocks

Price / book
12.2×

Cheaper than 9% of US stocks

EV / EBITDA
19.5×

Cheaper than 14% of US stocks

Growth & margins
Revenue growth (YoY)
13.3%

Higher than 70% of US stocks

Earnings growth (YoY)
67.6%

Higher than 69% of US stocks

Gross margin
29.6%

Higher than 34% of US stocks

Operating margin
17.6%

Higher than 70% of US stocks

Net margin
10.8%

Higher than 69% of US stocks

Returns & dividend
Return on equity
42.6%

Higher than 91% of US stocks

Return on assets
13.8%

Higher than 95% of US stocks

Dividend yield
0.7%

Higher than 16% of US dividend payers

Bars mark the percentile across the ~4,600 US stocks Ticker Nerd covers, among those reporting the figure.

Peers

ROST vs competitors

The nearest names by industry and size, scored by the same model — like for like.

Its peer group, ranked by the same modelApparel Retail
CompanyMarket capTKN rank
ROSTRoss Stores, Inc.$76.7B
93
TJXThe TJX Cos., Inc.$156.4B
68
BURLBurlington Stores, Inc.$20.5B
51
LULUlululemon athletica, Inc.$14.6B
36
GAPGap, Inc.$7.4B
61
VSXYVictoria's Secret & Co.$6.9B
84
URBNUrban Outfitters, Inc.$6.4B
65

Look up any of the roughly 4,600 stocks we score.

The rank is the raw material. Whether the rules would actually own Ross Stores, Inc. — and when they’d sell — is the membership. See the Ticker Nerd 20 →

News

Latest ROST news & analysis

Ross Stores Grew Comparable Sales 10%. TJX Grew 4%.

The Motley Fool · 22 Aug 2026positive

Ross Stores reported fiscal second-quarter earnings of $2.66 per share, beating its own guidance even after excluding $0.60 in tariff refunds, and grew comparable sales 10% versus TJX's 4% growth.

Why it matters — ROST watchers would note that the company outperformed its own expectations and grew comparable sales more than twice as fast as peer TJX.

Why Ross Stores Stock Is Up Today

The Motley Fool · 21 Aug 2026positive

Ross Stores stock rose after the company reported that its value-focused strategy, offering savings of up to 70%, is attracting cost-conscious consumers while profit margins improve as it expands its store count.

Why it matters — A Ross investor would care because the update indicates the company's off-price model is successfully driving both customer traffic and profitability amid consumer financial pressure.

Ross Stores Q2 Earnings Top Estimates on Strong Sales Growth Momentum

Zacks Investment Research · 21 Aug 2026positive

Ross Stores reported second-quarter earnings and sales that beat estimates, driven by strong store traffic, comparable sales growth, and improved margins.

Why it matters — A ROST watcher would care because the quarterly beats and sales momentum signal continued operational strength for the company.

Ross Stores Just Flipped the Off-Price Retail Story After TJX's Marmaxx Miss

MarketBeat · 21 Aug 2026positive

Ross Stores' stock fell over 2% before the company reported its Q2 2026 earnings, but the narrative shifted after the results were released. The report follows a miss by TJX's Marmaxx division, positioning Ross differently in the off-price retail space.

Why it matters — ROST watchers would care because the earnings report, coming after a competitor's miss, could signal how Ross is faring relative to the broader off-price retail sector.

Ross Stores Hikes Its Outlook as Bargain-Hunting Shoppers Drive Up Sales. The Stock Is Surging

Investopedia · 21 Aug 2026positive

Ross Stores reported quarterly results that topped estimates and raised its full-year outlook, citing strong demand for its discounted offerings. The news drove the company's stock higher on Friday.

Why it matters — A raised outlook and strong demand for bargains signal healthy momentum for the discount retailer, which is relevant to investors tracking ROST's performance.

FAQ

Frequently asked questions about ROST stock

What is the ROST stock price forecast for 2026-2027?

The 20 Wall Street analysts covering Ross Stores, Inc. have a median 12-month price target of $283, with estimates ranging from $176 to $310. These are third-party analyst estimates, not Ticker Nerd forecasts, and they are frequently wrong.

Is ROST stock a buy right now?

Of the 20 analysts covering Ross Stores, Inc., 14 rate it a Buy, 5 a Hold and 1 a Sell. Ticker Nerd's systematic factor model ranks Ross Stores, Inc. 93 out of 100 across roughly 4,600 US stocks as at 22 Aug 2026. None of this is personal advice — it does not consider your circumstances.

How does Ticker Nerd's model rank ROST?

As at 22 Aug 2026, Ross Stores, Inc. ranks 93 out of 100 on Ticker Nerd's systematic factor model — a percentile across roughly 4,600 US stocks, built from its factor families. Its strongest factor family is Revisions (95 of 100).

Will ROST stock go up?

No one can know that. What the data says: the median 12-month target from 20 analysts implies +18.2% from the last close, and Ticker Nerd's factor model ranks Ross Stores, Inc. 93 out of 100 as at 22 Aug 2026. Analyst targets are third-party estimates and frequently wrong; none of this is personal advice.

What is the ROST stock forecast for 2030?

No analyst covering Ross Stores, Inc. publishes a 2030 price target — Wall Street targets run 12 to 18 months out. Sites quoting a 2030 price for ROST are extrapolating price history, which says nothing about the business. The furthest attributed numbers are the current analyst targets: $176 to $310 over the next 12 months.

How has ROST stock performed over the past year?

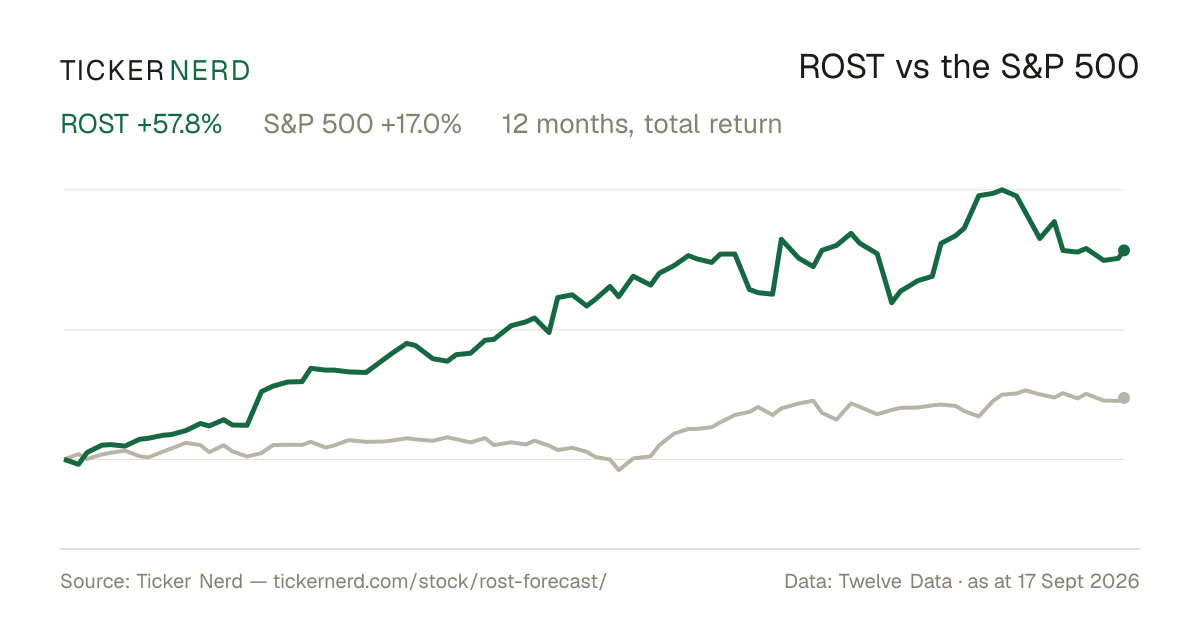
Ross Stores, Inc. returned +65.6% over the 12 months to 21 Aug 2026, with dividends reinvested. Past performance does not indicate future returns.

What does Ross Stores, Inc. do?

Ross Stores, Inc. is a U.S.-based off-price apparel and home fashion retailer focused on delivering branded merchandise at discounted prices to value-conscious consumers.

What is the latest news on ROST?

The most recent item we track (The Motley Fool, 22 Aug 2026): "Ross Stores Grew Comparable Sales 10%. TJX Grew 4%.". Ross Stores reported fiscal second-quarter earnings of $2.66 per share, beating its own guidance even after excluding $0.60 in tariff refunds, and grew comparable sales 10% versus TJX's 4% growth.

Company

About Ross Stores, Inc.

Ross Stores, Inc. is a U.S.-based off-price apparel and home fashion retailer focused on delivering branded merchandise at discounted prices to value-conscious consumers. The company operates retail chains under the Ross Dress for Less and dd’s Discounts banners, offering a broad assortment of in-season clothing, footwear, accessories, and home décor items for the family and household. Its stores emphasize everyday savings, typically positioning prices below those of traditional department and specialty retailers, supported by an opportunistic and flexible merchandising model that sources deals across the supply chain. Ross Stores, Inc. serves a wide demographic across urban, suburban, and smaller markets in the United States, with a footprint spanning multiple states and territories. The business plays a significant role in the off-price retail segment, providing an alternative to full-price retail for consumers seeking recognized brands and fashion-oriented products at lower cost. Headquartered in the United States, Ross Stores, Inc. is considered a major participant in the consumer cyclical sector, particularly within the discount and off-price retail industry.

CEO Mr. James G. Conroy · 111,000 employees · United States · https://www.rossstores.com