TJXTJXConsumer Cyclical · Apparel Retail

TJX Stock Forecast: The TJX Cos., Inc. Price Predictions for 2026-2027

Last close, 21 Aug 2026
$141
−0.12% on the day

The 22 Wall Street analysts covering The TJX Cos., Inc. hold a median 12-month price target of $177 — +25.6% from the last close. Ticker Nerd's systematic factor model, run across ~4,600 US stocks, ranks it 68 of 100 as at 22 Aug 2026 — in the upper half.

Market cap
$155.2B
Ticker Nerd rank
68 / 100
Median analyst target
$177
Analysts covering
22
Total return, dividends reinvested
1W
−7.6%
1M
−9.1%
YTD
−7.7%
1Y
+3.4%
From 52W high
−16.3%
From 52W low
+5.0%
$134
$168
52-week range, adjusted closes · the dot is the last close
Ticker Nerd rank

TJX stock analysis: one number for the whole business

Consensus tells you what everyone already believes. The model scores The TJX Cos., Inc. on its factor families — the same systematic rank behind the Ticker Nerd portfolio.

Where the model ranks itAs at 22 Aug 2026
68 / 100

Percentile across ~4,600 US stocks on Ticker Nerd’s systematic factor model. Higher is better. How the model is built and tested

Volatility
95
Quality
90
Revisions
78
Growth
71
Momentum
66
Issuance
53
Value
43
Accruals
37
Size
2

Volatility (95): The share price has been relatively steady.

Accruals (37): A large share of reported profit has not shown up as cash, or the balance sheet is expanding quickly — both tend to unwind.

Size (2): Larger than most of the companies we track — more scrutinised, less often mispriced.

Built and run by Aslam Ghouse, an ex-Goldman Sachs quant trader with fourteen years in markets.

Wall Street

TJX stock forecast 2026-2027: analyst price targets & predictions

The bullish and bearish analyst opinions on TJX, reported as data — targets and ratings, the market's view beside the model's.

Share price and the analyst range, 12 monthsAdjusted close, US dollars
$120$140$160$180$200Oct 25Jan 26Apr 26Jul 26TJXHigh $198Median $177Low $125

Price targets and ratings are third-party analyst estimates, reported here as data. They are not Ticker Nerd forecasts, and they are frequently wrong.

What Wall Street says22 analysts
19 Buy2 Hold1 Sell
Low $125Median $177High $198

The green dot is the last close — the median target sits +25.6% from it.

Recent analyst actionsNewest first

Of the 20 most recent actions, 7 moved their price target up and 5 moved it down.

DateFirmActionRatingTarget
20 Aug 2026BarclaysMaintainsOverweight$190$188
20 Aug 2026BTIGReiteratesBuy$190
20 Aug 2026CitigroupDowngradeNeutral$182$154
20 Aug 2026Evercore ISI GroupMaintainsOutperform$175$173
20 Aug 2026Gordon HaskettDowngradeAccumulate$155
20 Aug 2026Morgan StanleyMaintainsOverweight$181$178
20 Aug 2026UBSMaintainsBuy$197$198
20 Aug 2026Wells FargoMaintainsEqual-Weight$160$140
21 May 2026BairdMaintainsOutperform
21 May 2026BairdMaintainsOutperform$172$175
21 May 2026BarclaysMaintainsOverweight
21 May 2026BarclaysMaintainsOverweight$183$190
21 May 2026BTIGMaintainsBuy$185$190
21 May 2026BTIGMaintainsBuy
21 May 2026CitigroupMaintainsBuy
21 May 2026CitigroupMaintainsBuy$168$182
21 May 2026Evercore ISI GroupMaintainsOutperform$171$175
21 May 2026Evercore ISI GroupMaintainsOutperform
21 May 2026Telsey Advisory GroupMaintainsOutperform
21 May 2026Telsey Advisory GroupMaintainsOutperform$175$185

Price targets and ratings are third-party analyst estimates, reported here as data. They are not Ticker Nerd forecasts, and they are frequently wrong.

Market Radar

This page is one stock. Monday covers all of them.

Computed off the Friday close and sent before the US open.

Market Radar reports the week’s largest rank changes across roughly 4,600 US stocks, the factor behind each one, and where the market went. TJX appears on the weeks it earns a place.

Free, every Monday. Unsubscribe any time.

Estimates

TJX analyst estimate revisions

Not the forecast itself — the direction analysts are revising it. Revision direction is one of the model's factor families.

Which way the estimates are movingNext fiscal year
EPS revision, 90 days
+2.3%
Analysts raising
1
Analysts cutting
0
Fundamentals

The TJX Cos., Inc. (TJX) financial data

A margin means little on its own. Each bar marks where the figure sits across the whole US universe we score.

Valuation
Trailing P/E
26.0×

Cheaper than 30% of US stocks

Price / sales
2.5×

Cheaper than 48% of US stocks

Price / book
14.9×

Cheaper than 7% of US stocks

EV / EBITDA
18.6×

Cheaper than 17% of US stocks

Growth & margins
Revenue growth (YoY)
5.4%

Higher than 40% of US stocks

Earnings growth (YoY)
22.3%

Higher than 61% of US stocks

Gross margin
31.3%

Higher than 37% of US stocks

Operating margin
10.9%

Higher than 65% of US stocks

Net margin
9.7%

Higher than 69% of US stocks

Returns & dividend
Return on equity
62.2%

Higher than 94% of US stocks

Return on assets
13.5%

Higher than 96% of US stocks

Dividend yield
1.4%

Higher than 32% of US dividend payers

Bars mark the percentile across the ~4,600 US stocks Ticker Nerd covers, among those reporting the figure.

Peers

TJX vs competitors

The nearest names by industry and size, scored by the same model — like for like.

Its peer group, ranked by the same modelApparel Retail
CompanyMarket capTKN rank
TJXThe TJX Cos., Inc.$155.2B
68
ROSTRoss Stores, Inc.$77.3B
93
BURLBurlington Stores, Inc.$20.5B
51
LULUlululemon athletica, Inc.$14.6B
36
BKNGBooking Holdings, Inc.*$163.1B
77
GAPGap, Inc.$7.4B
61
VSXYVictoria's Secret & Co.$6.9B
84

* Nearest Consumer Cyclical names by size — few apparel retail companies of this scale trade in the US universe.

Look up any of the roughly 4,600 stocks we score.

The rank is the raw material. Whether the rules would actually own The TJX Cos., Inc. — and when they’d sell — is the membership. See the Ticker Nerd 20 →

News

Latest TJX news & analysis

Ross Stores Grew Comparable Sales 10%. TJX Grew 4%.

The Motley Fool · 22 Aug 2026neutral

Ross Stores reported comparable sales growth of 10% in its fiscal second quarter, while TJX grew comparable sales 4%. TJX beat its plan on sales, margin, and earnings, raised its full-year outlook, but its stock still fell after its report.

Why it matters — The comparison highlights that TJX's 4% comparable sales growth trailed Ross Stores' 10% growth, even though TJX beat its own guidance and raised its outlook.

Retail Earnings Recap: TJX Earnings Sell-Off Opportunity & WMT Options Trade

Schwab Network · 21 Aug 2026positive

A retail analyst discussed the varying earnings results from Walmart, Ross Stores, and Target, then focused on TJX Companies, describing its post-earnings share price decline as a buying opportunity.

Why it matters — TJX watchers would note that a retail analyst views the stock's post-earnings sell-off as an opportunity following the mixed results from its retail peers.

Ross Stores Just Flipped the Off-Price Retail Story After TJX's Marmaxx Miss

MarketBeat · 21 Aug 2026neutral

Ross Stores' stock fell over 2% ahead of reporting its Q2 2026 earnings, but after the report the story shifted, with the stock rising roughly 4.9%. The items positions Ross's performance as following TJX's Marmaxx miss.

Why it matters — A TJX watcher would note that a major off-price competitor reported an upbeat earnings result right after TJX's Marmaxx segment underperformed, highlighting competitive dynamics in the off-price retail sector.

Ross Jumps 8% on 10% Comp Growth, TJX Ticks Up, Macy's Edges Higher

24/7 Wall Street · 21 Aug 2026positive

Shares of Ross Stores rose 8% to $246.60 after the off-price chain reported a strong fiscal Q2 2026 quarter featuring 10% comparable-store growth. In the same report, TJX ticked up while Macy's edged higher.

Why it matters — A strong quarterly performance by off-price peer Ross Stores may draw attention to the broader off-price retail segment in which TJX operates.

These Analysts Cut Their Forecasts On TJX Following Q2 Earnings

Benzinga · 20 Aug 2026negative

TJX posted upbeat second-quarter results on Wednesday. Following the earnings release, some analysts cut their forecasts on the company.

Why it matters — A TJX watcher would care because analyst forecast cuts after the earnings report signal revised expectations for the company's outlook.

FAQ

Frequently asked questions about TJX stock

What is the TJX stock price forecast for 2026-2027?

The 22 Wall Street analysts covering The TJX Cos., Inc. have a median 12-month price target of $177, with estimates ranging from $125 to $198. These are third-party analyst estimates, not Ticker Nerd forecasts, and they are frequently wrong.

Is TJX stock a buy right now?

Of the 22 analysts covering The TJX Cos., Inc., 19 rate it a Buy, 2 a Hold and 1 a Sell. Ticker Nerd's systematic factor model ranks The TJX Cos., Inc. 68 out of 100 across roughly 4,600 US stocks as at 22 Aug 2026. None of this is personal advice — it does not consider your circumstances.

How does Ticker Nerd's model rank TJX?

As at 22 Aug 2026, The TJX Cos., Inc. ranks 68 out of 100 on Ticker Nerd's systematic factor model — a percentile across roughly 4,600 US stocks, built from its factor families. Its strongest factor family is Volatility (95 of 100).

Will TJX stock go up?

No one can know that. What the data says: the median 12-month target from 22 analysts implies +25.6% from the last close, and Ticker Nerd's factor model ranks The TJX Cos., Inc. 68 out of 100 as at 22 Aug 2026. Analyst targets are third-party estimates and frequently wrong; none of this is personal advice.

What is the TJX stock forecast for 2030?

No analyst covering The TJX Cos., Inc. publishes a 2030 price target — Wall Street targets run 12 to 18 months out. Sites quoting a 2030 price for TJX are extrapolating price history, which says nothing about the business. The furthest attributed numbers are the current analyst targets: $125 to $198 over the next 12 months.

How has TJX stock performed over the past year?

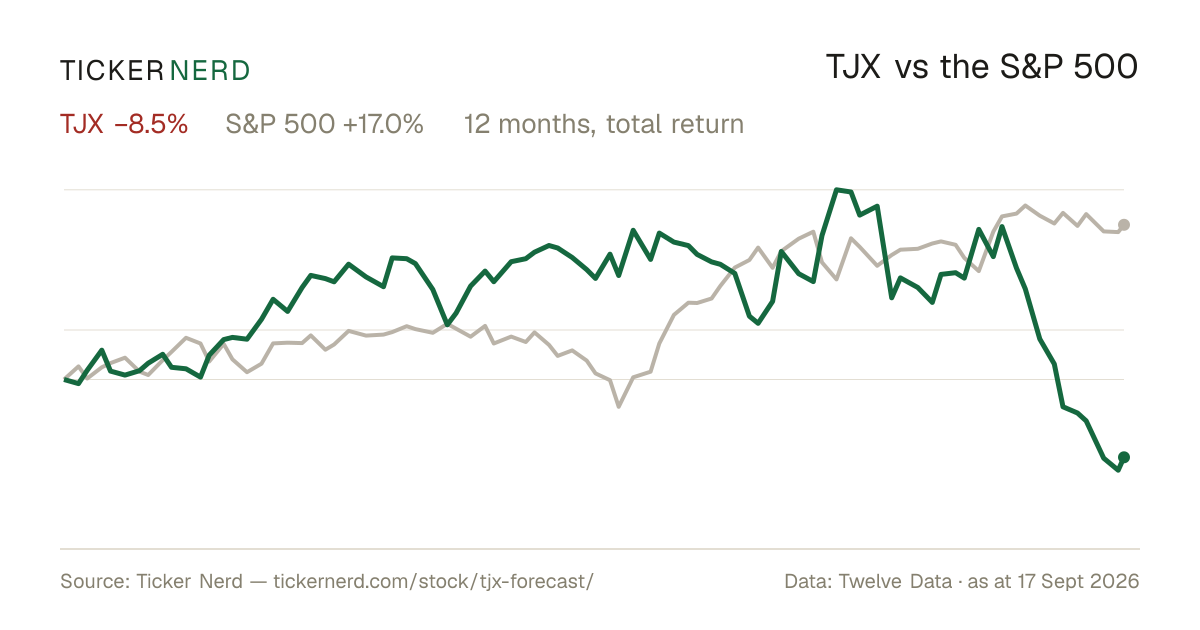
The TJX Cos., Inc. returned +3.4% over the 12 months to 21 Aug 2026, with dividends reinvested. Past performance does not indicate future returns.

What does The TJX Cos., Inc. do?

The TJX Companies, Inc. is a leading off-price retailer of apparel, footwear, accessories, and home fashions.

What is the latest news on TJX?

The most recent item we track (The Motley Fool, 22 Aug 2026): "Ross Stores Grew Comparable Sales 10%. TJX Grew 4%.". Ross Stores reported comparable sales growth of 10% in its fiscal second quarter, while TJX grew comparable sales 4%. TJX beat its plan on sales, margin, and earnings, raised its full-year outlook, but its stock still fell after its report.

Company

About The TJX Cos., Inc.

The TJX Companies, Inc. is a leading off-price retailer of apparel, footwear, accessories, and home fashions. The company operates through Marmaxx, HomeGoods, TJX Canada, and TJX International, serving shoppers with a broad mix of branded and private-label merchandise at value-oriented prices. Its business covers family apparel, beauty and jewelry accessories, home basics, decorative items, furniture, rugs, lighting, tabletop, cookware, pet products, and seasonal goods. TJX also sells through a combination of stores and digital channels, supporting its role in the global specialty retail market. Headquartered in Framingham, Massachusetts, The TJX Companies, Inc. focuses on merchandise variety, rapid inventory turnover, and a flexible off-price model that appeals to budget-conscious consumers across the U.S., Canada, Europe, and Australia.

CEO Mr. Ernie L. Herrman · 377,000 employees · United States · https://www.tjx.com