SKYSKYConsumer Cyclical · Residential Construction

SKY Stock Forecast: Champion Homes, Inc. Price Predictions for 2026-2027

Last close, 3 Aug 2026
$81
+1.53% on the day

The 6 Wall Street analysts covering Champion Homes, Inc. hold a median 12-month price target of $93 — +14.4% from the last close. Ticker Nerd's systematic factor model, run across ~4,600 US stocks, ranks it 62 of 100 as at 3 Aug 2026 — in the upper half.

Market cap
$4.4B
Ticker Nerd rank
62 / 100
Median analyst target
$93
Analysts covering
6
Total return, dividends reinvested
1W
−1.8%
1M
−5.2%
YTD
−4.3%
1Y
+24.7%
From 52W high
−17.1%
From 52W low
+25.8%
$64
$97
52-week range, adjusted closes · the dot is the last close
Ticker Nerd rank

SKY stock analysis: one number for the whole business

Consensus tells you what everyone already believes. The model scores Champion Homes, Inc. on its factor families — the same systematic rank behind the Ticker Nerd portfolio.

Where the model ranks itAs at 3 Aug 2026
62 / 100

Percentile across ~4,600 US stocks on Ticker Nerd’s systematic factor model. Higher is better. How the model is built and tested

Issuance
92
Quality
77
Accruals
65
Momentum
59
Growth
59
Revisions
52
Volatility
39
Value
32
Size
25

Issuance (92): The share count has been shrinking and the company is not leaning on new borrowing.

Value (32): The shares cost a lot relative to the profits and assets behind them.

Size (25): Larger than most of the companies we track — more scrutinised, less often mispriced.

The rank is the raw material. Whether the rules would actually own Champion Homes, Inc. — and when they’d sell — is the membership.

Wall Street

SKY stock forecast 2026-2027: analyst price targets & predictions

The bullish and bearish analyst opinions on SKY, reported as data — targets and ratings, the market's view beside the model's.

Share price and the analyst range, 12 monthsAdjusted close, US dollars
$60$70$80$90$100Oct 25Jan 26Apr 26Jul 26SKYHigh $102Median $93Low $78

Price targets and ratings are third-party analyst estimates, reported here as data. They are not Ticker Nerd forecasts, and they are frequently wrong.

What Wall Street says6 analysts
5 Buy1 Hold0 Sell
Low $78Median $93High $102

The green dot is the last close — the median target sits +14.4% from it.

Recent analyst actionsNewest first
DateFirmActionRatingTarget
14 July 2026BarclaysMaintainsOverweight$94$102
5 June 2026CitigroupInitiatesBuy
27 May 2026BarclaysMaintainsOverweight
27 May 2026RBC CapitalMaintainsOutperform
8 Apr 2026BarclaysMaintainsOverweight
15 Jan 2026BarclaysMaintainsOverweight
8 Dec 2025BarclaysUpgradeOverweight
7 Nov 2025Zelman & AssocUpgradeOutperform
6 Nov 2025BarclaysMaintainsEqual-Weight
6 Nov 2025RBC CapitalUpgradeOutperform
7 Aug 2025BarclaysMaintainsEqual-Weight
7 Aug 2025RBC CapitalMaintainsSector Perform
5 June 2025Zelman & AssocUpgradeNeutral
28 May 2025BarclaysMaintainsEqual-Weight
28 May 2025RBC CapitalMaintainsSector Perform
8 Apr 2025BarclaysMaintainsEqual-Weight
6 Feb 2025BarclaysMaintainsEqual-Weight
6 Feb 2025RBC CapitalMaintainsSector Perform
15 Jan 2025Zelman & AssocInitiatesUnderperform
31 Oct 2024BarclaysMaintainsEqual-Weight

Price targets and ratings are third-party analyst estimates, reported here as data. They are not Ticker Nerd forecasts, and they are frequently wrong.

Estimates

SKY analyst estimate revisions

Not the forecast itself — the direction analysts are revising it. Revision direction is one of the model's factor families.

Which way the estimates are movingNext fiscal year
EPS revision, 90 days
−8.6%
Analysts raising
0
Analysts cutting
4
Fundamentals

Champion Homes, Inc. (SKY) financial data

A margin means little on its own. Each bar marks where the figure sits across the whole US universe we score.

Valuation
Trailing P/E
21.8×

Cheaper than 36% of US stocks

Price / sales
1.6×

Cheaper than 58% of US stocks

Price / book
2.8×

Cheaper than 36% of US stocks

EV / EBITDA
12.7×

Cheaper than 30% of US stocks

Growth & margins
Revenue growth (YoY)
4.6%

Higher than 40% of US stocks

Earnings growth (YoY)
−18.4%

Higher than 20% of US stocks

Gross margin
24.8%

Higher than 29% of US stocks

Operating margin
6.4%

Higher than 60% of US stocks

Net margin
7.8%

Higher than 66% of US stocks

Returns & dividend
Return on equity
13.7%

Higher than 72% of US stocks

Return on assets
7.6%

Higher than 87% of US stocks

Dividend yield
3.1%

Higher than 67% of US dividend payers

Bars mark the percentile across the ~4,600 US stocks Ticker Nerd covers, among those reporting the figure.

Peers

SKY vs competitors

The nearest names by industry and size, scored by the same model — like for like.

Its peer group, ranked by the same modelResidential Construction
CompanyMarket capTKN rank
SKYChampion Homes, Inc.$4.4B
62
CVCOCavco Industries, Inc.$4.3B
MTHMeritage Homes Corp.$4.8B
MHOM/I Homes, Inc.$3.9B
KBHKB Home$3.6B
IBPInstalled Building Products, Inc.$6.2B
61
GRBKGreen Brick Partners, Inc.$3.1B
54
Market Radar

This page is one stock. Monday covers all of them.

Computed off the Friday close and sent before the US open.

Market Radar reports the week’s largest rank changes across roughly 4,600 US stocks, the factor behind each one, and where the market went. SKY appears on the weeks it earns a place.

Free, every Monday. Unsubscribe any time.

FAQ

Frequently asked questions about SKY stock

What is the SKY stock price forecast for 2026-2027?

The 6 Wall Street analysts covering Champion Homes, Inc. have a median 12-month price target of $93, with estimates ranging from $78 to $102. These are third-party analyst estimates, not Ticker Nerd forecasts, and they are frequently wrong.

Is SKY stock a buy right now?

Of the 6 analysts covering Champion Homes, Inc., 5 rate it a Buy, 1 a Hold and 0 a Sell. Ticker Nerd's systematic factor model ranks Champion Homes, Inc. 62 out of 100 across roughly 4,600 US stocks as at 3 Aug 2026. None of this is personal advice — it does not consider your circumstances.

How does Ticker Nerd's model rank SKY?

As at 3 Aug 2026, Champion Homes, Inc. ranks 62 out of 100 on Ticker Nerd's systematic factor model — a percentile across roughly 4,600 US stocks, built from its factor families. Its strongest factor family is Issuance (92 of 100).

Will SKY stock go up?

No one can know that. What the data says: the median 12-month target from 6 analysts implies +14.4% from the last close, and Ticker Nerd's factor model ranks Champion Homes, Inc. 62 out of 100 as at 3 Aug 2026. Analyst targets are third-party estimates and frequently wrong; none of this is personal advice.

What is the SKY stock forecast for 2030?

No analyst covering Champion Homes, Inc. publishes a 2030 price target — Wall Street targets run 12 to 18 months out. Sites quoting a 2030 price for SKY are extrapolating price history, which says nothing about the business. The furthest attributed numbers are the current analyst targets: $78 to $102 over the next 12 months.

How has SKY stock performed over the past year?

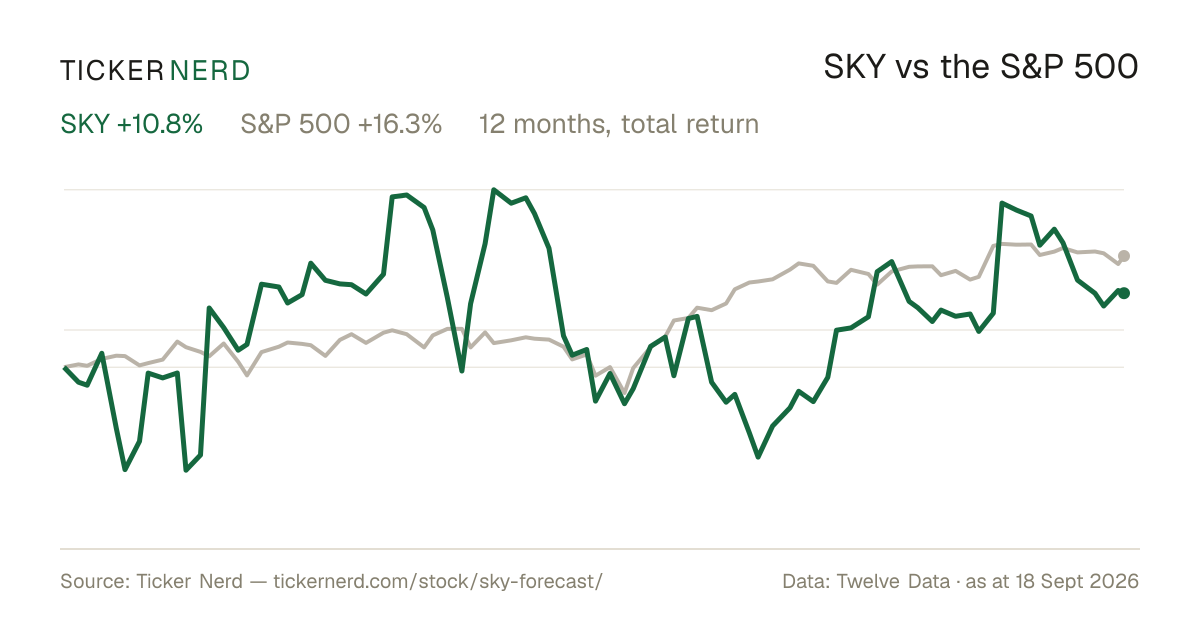
Champion Homes, Inc. returned +24.7% over the 12 months to 3 Aug 2026, with dividends reinvested. Past performance does not indicate future returns.

What does Champion Homes, Inc. do?

Skyline Champion Corporation operates as a prominent player in the manufactured housing industry. The company is primarily focused on designing and producing a diverse range of manufactured and modular homes, along with park models and modular buildings, catering to both residential and commercial markets.

Company

About Champion Homes, Inc.

Skyline Champion Corporation operates as a prominent player in the manufactured housing industry. The company is primarily focused on designing and producing a diverse range of manufactured and modular homes, along with park models and modular buildings, catering to both residential and commercial markets. Skyline Champion provides an affordable and efficient housing solution, emphasizing quality and customization. The company’s offerings are distinguished by their flexibility and broad appeal, addressing diverse needs from individual homeowners to large-scale developers. By operating a comprehensive network of manufacturing facilities across North America, Skyline Champion ensures wide distribution and accessibility. Its products importantly impact urban planning and regional housing policies, contributing to affordable housing strategies in various communities. In the broader financial market, Skyline Champion plays a significant role in the real estate and construction sectors, reflecting trends in housing demand and economic conditions. Through innovation and responsiveness to market needs, Skyline Champion Corporation continues to influence the evolution and acceptance of prefabricated home solutions.

CEO Mr. Timothy Mark Larson · 9,300 employees · United States · https://www.championhomes.com