SKYATechnology · Software - Infrastructure

SKYA Stock Forecast: SkyAI, Inc. Price Predictions for 2026-2027

Last close, 3 Aug 2026
$1.29
−1.53% on the day

Ticker Nerd's systematic factor model, run across ~4,600 US stocks, ranks it 8 of 100 as at 1 Aug 2026 — in the weakest quartile.

Market cap
$55.4M
Ticker Nerd rank
8 / 100
Median analyst target
Analysts covering
Total return, dividends reinvested
1W
−2.3%
1M
+4.9%
YTD
−36.5%
1Y
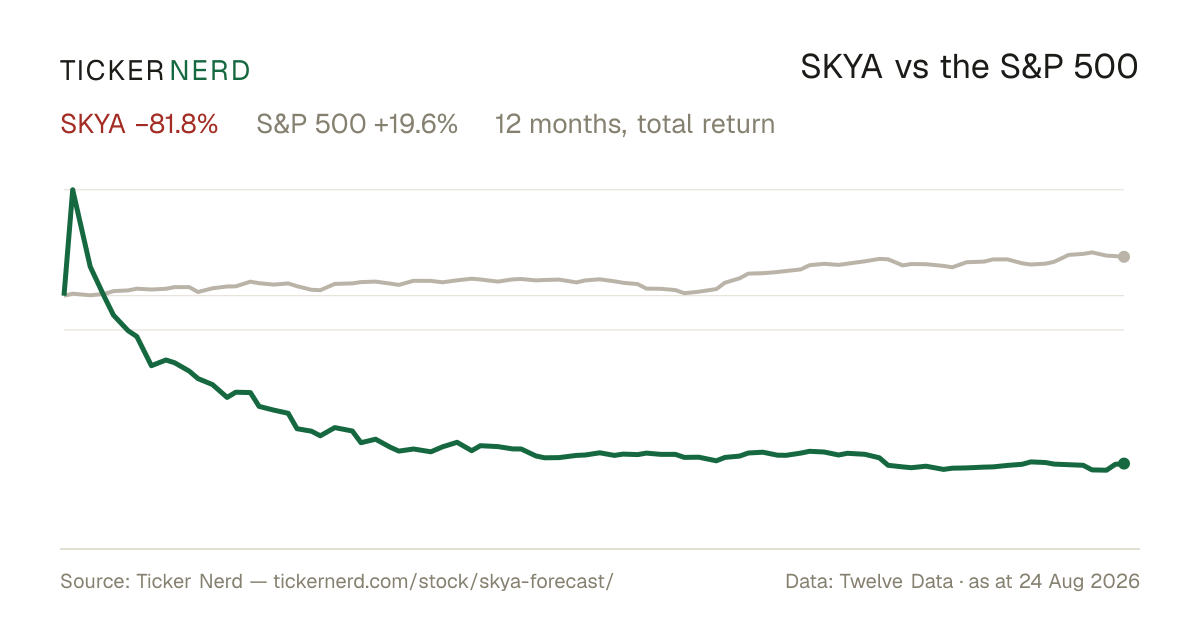
−73.3%
From 52W high
−92.0%
From 52W low
+35.8%
$1
$16
52-week range, adjusted closes · the dot is the last close
Ticker Nerd rank

SKYA stock analysis: one number for the whole business

Consensus tells you what everyone already believes. The model scores SkyAI, Inc. on its factor families — the same systematic rank behind the Ticker Nerd portfolio.

Where the model ranks itAs at 1 Aug 2026
8 / 100

Percentile across ~4,600 US stocks on Ticker Nerd’s systematic factor model. Higher is better. How the model is built and tested

Size
81
Accruals
69
Growth
25
Revisions
25
Issuance
23
Volatility
14
Momentum
11
Quality
8
Value
6

Size (81): Smaller than most of the companies we track.

Value (6): The shares cost a lot relative to the profits and assets behind them.

The rank is the raw material. Whether the rules would actually own SkyAI, Inc. — and when they’d sell — is the membership.

Wall Street

SKYA stock forecast 2026-2027: analyst price targets & predictions

The bullish and bearish analyst opinions on SKYA, reported as data — targets and ratings, the market's view beside the model's.

Share price and the analyst range, 12 monthsAdjusted close, US dollars
$0$2$4$6$8$10$12Oct 25Jan 26Apr 26Jul 26SKYA

Price targets and ratings are third-party analyst estimates, reported here as data. They are not Ticker Nerd forecasts, and they are frequently wrong.

Price targets and ratings are third-party analyst estimates, reported here as data. They are not Ticker Nerd forecasts, and they are frequently wrong.

Estimates

SKYA analyst estimate revisions

Not the forecast itself — the direction analysts are revising it. Revision direction is one of the model's factor families.

Fundamentals

SkyAI, Inc. (SKYA) financial data

A margin means little on its own. Each bar marks where the figure sits across the whole US universe we score.

Valuation
Trailing P/E
23.3×

Cheaper than 34% of US stocks

Price / sales
16.4×

Cheaper than 10% of US stocks

Price / book
0.3×

Cheaper than 87% of US stocks

EV / EBITDA
−2.6×

Cheaper than 74% of US stocks

Growth & margins
Revenue growth (YoY)
−288.6%

Higher than 1% of US stocks

Earnings growth (YoY)
Gross margin
−5.1%

Higher than 5% of US stocks

Operating margin
−137.2%

Higher than 12% of US stocks

Net margin
−202.5%

Higher than 2% of US stocks

Returns & dividend
Return on equity
−380.3%

Higher than 3% of US stocks

Return on assets
−10.3%

Higher than 26% of US stocks

Dividend yield

Bars mark the percentile across the ~4,600 US stocks Ticker Nerd covers, among those reporting the figure.

Peers

SKYA vs competitors

The nearest names by industry and size, scored by the same model — like for like.

Its peer group, ranked by the same modelSoftware - Infrastructure
CompanyMarket capTKN rank
SKYASkyAI, Inc.$55.4M
8
VHCVirnetX Holding Corp.$55.5M
28
USIOUSIO, Inc.$56.4M
63
AIFCAI Financial Corp.$57.6M
6
AISPAirship AI Holdings, Inc.$59.8M
11
LIDRAEye, Inc.$51.4M
35
VIVOVivoPower Plc$59.9M
22
Market Radar

This page is one stock. Monday covers all of them.

Computed off the Friday close and sent before the US open.

Market Radar reports the week’s largest rank changes across roughly 4,600 US stocks, the factor behind each one, and where the market went. SKYA appears on the weeks it earns a place.

Free, every Monday. Unsubscribe any time.

FAQ

Frequently asked questions about SKYA stock

How does Ticker Nerd's model rank SKYA?

As at 1 Aug 2026, SkyAI, Inc. ranks 8 out of 100 on Ticker Nerd's systematic factor model — a percentile across roughly 4,600 US stocks, built from its factor families. Its strongest factor family is Size (81 of 100).

What is the SKYA stock forecast for 2030?

No analyst covering SkyAI, Inc. publishes a 2030 price target — Wall Street targets run 12 to 18 months out. Sites quoting a 2030 price for SKYA are extrapolating price history, which says nothing about the business.

How has SKYA stock performed over the past year?

SkyAI, Inc. returned -73.3% over the 12 months to 3 Aug 2026, with dividends reinvested. Past performance does not indicate future returns.

What does SkyAI, Inc. do?

SkyAI, Inc. Common Stock represents an equity interest in SkyAI, Inc., a company operating in the healthcare technology and medical equipment space.

Company

About SkyAI, Inc.

SkyAI, Inc. Common Stock represents an equity interest in SkyAI, Inc., a company operating in the healthcare technology and medical equipment space. The company focuses on applying advanced artificial intelligence and data-driven tools to clinical and operational workflows, aiming to support healthcare providers in diagnosis, treatment planning, and resource management. SkyAI, Inc. develops software-enabled solutions that can integrate with existing medical systems, helping hospitals, clinics, and other care settings enhance decision support and efficiency. Its offerings are positioned within the broader medical equipment and health technology ecosystem, interacting with imaging platforms, electronic health records, and related digital infrastructure. SkyAI, Inc. primarily serves institutional healthcare customers and partners in the life sciences and health services sectors. Headquartered in the United States, the company participates in a competitive, innovation-intensive segment of the healthcare market, where artificial intelligence and machine learning play an increasingly central role in clinical and operational decision-making.

CEO Mr. Martin J. Mannion · United States · https://www.theskyai.co