TPTechnology · Software - Infrastructure

TP Stock Forecast: Ticketplus Ltd. Price Predictions for 2026-2027

Last close, 14 Sept 2026
$8.13
−4.89% on the day

The 2 Wall Street analysts covering Ticketplus Ltd. hold a median 12-month price target of $13 — +64.8% from the last close. Ticker Nerd's systematic factor model, run across ~4,600 US stocks, ranks it 1 of 100 as at 14 Sept 2026 — in the weakest quartile. The Street sees upside; the factor read is a caution. That gap is the story on this page.

Market cap
$98.1M
Ticker Nerd rank
1 / 100
Median analyst target
$13
Analysts covering
2
Total return, dividends reinvested
1W
−9.5%
1M
+9.3%
From high
−20.7%
From low
+18.0%
$7
$10
Range since 7 Aug 2026, adjusted closes · the dot is the last close
Ticker Nerd rank

TP stock analysis: one number for the whole business

Consensus tells you what everyone already believes. The model scores Ticketplus Ltd. on its factor families — the same systematic rank behind the Ticker Nerd portfolio.

Where the model ranks itAs at 14 Sept 2026
1 / 100

Percentile across ~4,600 US stocks on Ticker Nerd’s systematic factor model. Higher is better. How the model is built and tested

Size
75
Revisions
36
Value
10
Accruals
8
Volatility
2
Momentum
2
Quality
2
Issuance
1
Growth
0

Size (75): Smaller than most of the companies we track.

Growth (0): Sales and profits are flat, shrinking, or growing more slowly than they were.

Built and run by Aslam Ghouse, an ex-Goldman Sachs quant trader with fourteen years in markets.

Wall Street

TP stock forecast 2026-2027: analyst price targets & predictions

The bullish and bearish analyst opinions on TP, reported as data — targets and ratings, the market's view beside the model's.

Share price and the analyst range, since 7 Aug 2026Adjusted close, US dollars
$6$8$10$12$14Aug 26Aug 26Aug 26Aug 26Sep 26Sep 26TPHigh $14Median $13Low $13

Price targets and ratings are third-party analyst estimates, reported here as data. They are not Ticker Nerd forecasts, and they are frequently wrong.

Data provided by Twelve Data

What Wall Street says2 analysts
2 Buy0 Hold0 Sell
Low $13Median $13High $14

The green dot is the last close — the median target sits +64.8% from it.

Price targets and ratings are third-party analyst estimates, reported here as data. They are not Ticker Nerd forecasts, and they are frequently wrong.

Market Radar

This page is one stock. Monday covers all of them.

Computed off the Friday close and sent before the US open.

Market Radar reports the week’s largest rank changes across roughly 4,600 US stocks, the factor behind each one, and where the market went. TP appears on the weeks it earns a place.

Free, every Monday. Unsubscribe any time.

Performance

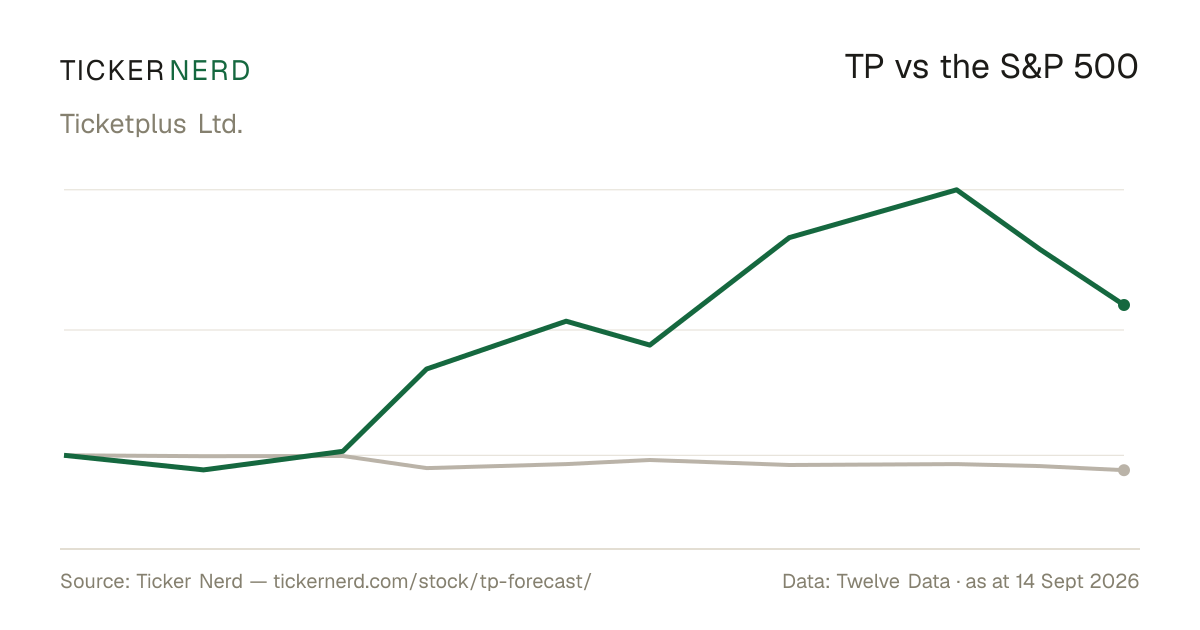
TP vs the S&P 500

Both lines are total return — dividends reinvested — so the comparison is honest on both sides.

TP vs S&P 500, last 12 monthsTotal return, rebased to 100
100110120130Aug 26Aug 26Aug 26Aug 26Sep 26Sep 26TPS&P 500

Download this chart as an image — free to reuse; link this page as the source.

Data provided by Twelve Data

Estimates

TP analyst estimate revisions

Not the forecast itself — the direction analysts are revising it. Revision direction is one of the model's factor families.

Which way the estimates are movingNext fiscal year
Analysts raising
0
Analysts cutting
0
Fundamentals

Ticketplus Ltd. (TP) financial data

A margin means little on its own. Each bar marks where the figure sits across the whole US universe we score.

Valuation
Trailing P/E
17.7×

Cheaper than 41% of US stocks

Price / sales
2.5×

Cheaper than 46% of US stocks

Price / book
14.7×

Cheaper than 6% of US stocks

EV / EBITDA
16.0×

Cheaper than 21% of US stocks

Growth & margins
Revenue growth (YoY)
80.8%

Higher than 91% of US stocks

Earnings growth (YoY)
116.5%

Higher than 86% of US stocks

Gross margin
46.3%

Higher than 57% of US stocks

Operating margin
27.0%

Higher than 85% of US stocks

Net margin
12.2%

Higher than 74% of US stocks

Returns & dividend
Return on equity
66.5%

Higher than 94% of US stocks

Return on assets
15.6%

Higher than 97% of US stocks

Dividend yield

Bars mark the percentile across the ~4,600 US stocks Ticker Nerd covers, among those reporting the figure.

Key statistics

Ticketplus Ltd. (TP) statistics: revenue, profit & scale

The headline figures, each with its date. Every row carries its own link — cite it straight from here.

  • Ticketplus Ltd. has a market value of $98.1M and an enterprise value of $96.2M.

  • Shares outstanding: 12.0M.

  • Trailing P/E: 17.7×; forward P/E: 10.6× — the forward figure prices analyst consensus estimates, not reported earnings.

  • Ticketplus Ltd. employs 28 people.

market figures as at 14 Sept 2026

Data provided by Twelve Data

Peers

TP vs competitors

The nearest names by industry and size, scored by the same model — like for like.

Its peer group, ranked by the same modelSoftware - Infrastructure
CompanyMarket capTKN rank
TPTicketplus Ltd.$98.1M
1
MBAIMBody AI Ltd.$96.3M
7
AIBAIB Data Centers, Inc.$101.1M
2
GOAIEva Live, Inc.$105.2M
5
ATGLAlpha Technology Group Ltd.$84.3M
12
VERIVeritone, Inc.$115.5M
32
TCXTucows, Inc.$116.1M
37

Look up any of the roughly 4,600 stocks we score.

The rank is the raw material. Whether the rules would actually own Ticketplus Ltd. — and when they’d sell — is the membership. See the Ticker Nerd 20 →

News

Latest TP news & analysis

Ticketplus Reports Results for the Six Months Ended June 30, 2026

Business Wire · 20 Aug 2026positive

Ticketplus announced its financial results for the six months ended June 30, 2026. Following its initial public offering in August, the company said it is entering an exciting new chapter with capital and resources to accelerate growth.

Why it matters — The half-year results offer TP watchers an update on the company's financial performance following its recent IPO and a statement on its growth outlook.

FAQ

Frequently asked questions about TP stock

What is the TP stock price forecast for 2026-2027?

The 2 Wall Street analysts covering Ticketplus Ltd. have a median 12-month price target of $13, with estimates ranging from $13 to $14. These are third-party analyst estimates, not Ticker Nerd forecasts, and they are frequently wrong.

Is TP stock a buy right now?

Of the 2 analysts covering Ticketplus Ltd., 2 rate it a Buy, 0 a Hold and 0 a Sell. Ticker Nerd's systematic factor model ranks Ticketplus Ltd. 1 out of 100 across roughly 4,600 US stocks as at 14 Sept 2026. None of this is personal advice — it does not consider your circumstances.

How does Ticker Nerd's model rank TP?

As at 14 Sept 2026, Ticketplus Ltd. ranks 1 out of 100 on Ticker Nerd's systematic factor model — a percentile across roughly 4,600 US stocks, built from its factor families. Its strongest factor family is Size (75 of 100).

Will TP stock go up?

No one can know that. What the data says: the median 12-month target from 2 analysts implies +64.8% from the last close, and Ticker Nerd's factor model ranks Ticketplus Ltd. 1 out of 100 as at 14 Sept 2026. Analyst targets are third-party estimates and frequently wrong; none of this is personal advice.

What is the TP stock forecast for 2030?

No analyst covering Ticketplus Ltd. publishes a 2030 price target — Wall Street targets run 12 to 18 months out. Sites quoting a 2030 price for TP are extrapolating price history, which says nothing about the business. The furthest attributed numbers are the current analyst targets: $13 to $14 over the next 12 months.

What does Ticketplus Ltd. do?

Ticketplus Ltd. is a technology company that provides a full-stack platform for the live entertainment market across Latin America.

What is the latest news on TP?

The most recent item we track (Business Wire, 20 Aug 2026): "Ticketplus Reports Results for the Six Months Ended June 30, 2026". Ticketplus announced its financial results for the six months ended June 30, 2026. Following its initial public offering in August, the company said it is entering an exciting new chapter with capital and resources to accelerate growth.

Company

About Ticketplus Ltd.

Ticketplus Ltd. is a technology company that provides a full-stack platform for the live entertainment market across Latin America. The company’s software supports event discovery, primary ticketing, access control, payments, real-time analytics, and post-event insights, helping promoters, venues, sports organizations, and ticketing companies manage the full event lifecycle. Ticketplus operates through direct services in Chile and a SaaS model in other Latin American markets, where its technology is licensed to local operators under their own brands. Its platform is used across concerts, sports events, festivals, performing arts, nightlife, and corporate events, making it a core infrastructure provider for digital ticketing and event operations in the region. Ticketplus Ltd. is headquartered in Santiago, Chile.

CEO Mr. Chen Chen Chien-Fu · 28 employees · Chile · https://ticketplus.com