TCBX Logo

TCBX Stock Forecast: Third Coast Bancshares, Inc. Price Predictions for 2026

Home โ€บ Stocks โ€บ United States | NASDAQ | Financial Services | Banks - Regional

$38.48

+0.18 (0.47%)

TCBX Stock Forecast 2026-2027

$38.48
Current Price
$638.46M
Market Cap
4 Ratings
Buy 2
Hold 2
Sell 0
Wall St Analyst Ratings

Distance to TCBX Price Targets

+16.9%
To High Target of $45.00
+11.7%
To Median Target of $43.00
+4.0%
To Low Target of $40.00

TCBX Price Momentum

+1.8%
1 Week Change
-6.9%
1 Month Change
+24.2%
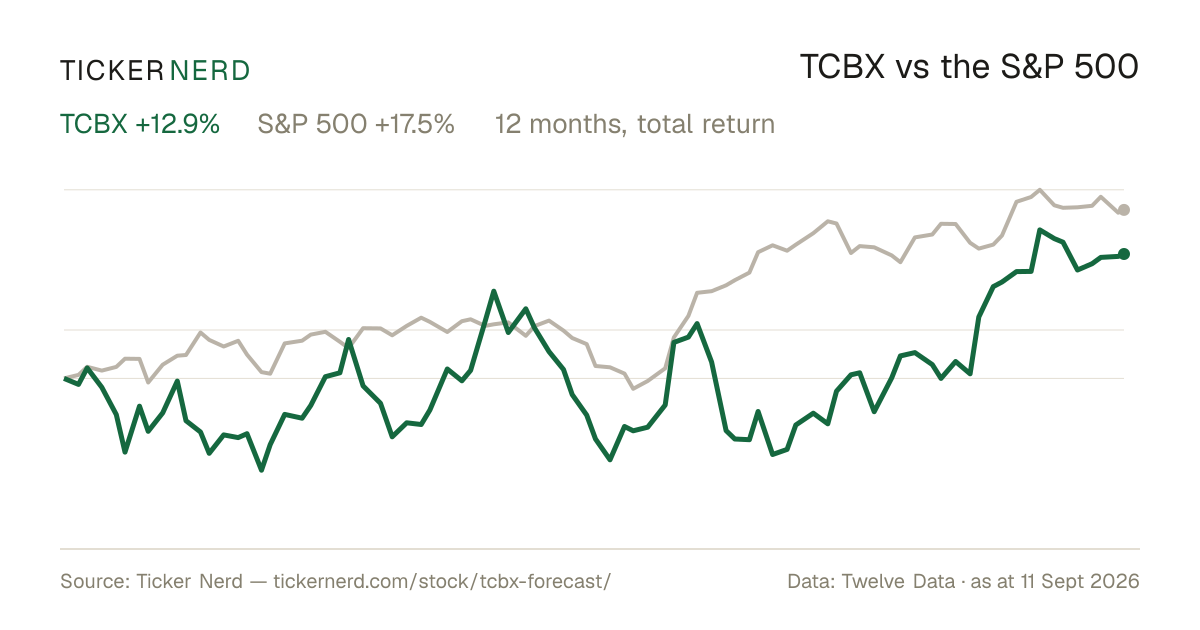
1 Year Change
+1.2%
Year-to-Date Change
-12.2%
From 52W High of $43.84
+29.7%
From 52W Low of $29.66
๐Ÿ“Š TOP ANALYST CALLS

Did TCBX Make This Month's Elite Buy List?

We don't follow just any analyst โ€” only the top 3% with a proven track record make our cut. See if Third Coast Bancshares is one of their latest high-conviction picks.

Join 5,000+ investors getting our data-driven analysis. Unsubscribe anytime.

Latest TCBX Stock Price Targets & Analyst Predictions

Based on our analysis of 9 Wall Street analysts, TCBX has a neutral consensus with a median price target of $43.00 (ranging from $40.00 to $45.00). The overall analyst rating is Buy (7.5/10). Currently trading at $38.48, the median forecast implies a 11.7% upside. This outlook is supported by 2 Buy, 2 Hold, and 0 Sell ratings.

Please note that analyst price targets are forward-looking estimates subject to substantial market, economic, and company-specific risks. Past performance does not guarantee future results, and actual stock performance may materially differ from these projections. Investors should conduct their own due diligence and consider their investment objectives and risk tolerance before making investment decisions.

TCBX Analyst Ratings

2
Buy
2
Hold
0
Sell

TCBX Price Target Range

Low
$40.00
Average
$43.00
High
$45.00
Current: $38.48

Latest TCBX Stock Forecasts by Analyst

These are the latest 20 analyst ratings and price targets for TCBX.

Date Firm Analyst Rating Change Price Target
Apr 24, 2026 Stephens & Co. Overweight Maintains $N/A
Apr 7, 2026 Raymond James Outperform Upgrade $N/A
Jan 26, 2026 Keefe, Bruyette & Woods Market Perform Maintains $N/A
Oct 30, 2025 Keefe, Bruyette & Woods Woody Lay Market Perform Maintains $43.00
Oct 28, 2025 Stephens & Co. Matt Olney Overweight Maintains $46.00
Jul 28, 2025 Keefe, Bruyette & Woods Woody Lay Market Perform Maintains $42.00
Apr 25, 2025 Keefe, Bruyette & Woods Wood Lay Market Perform Maintains $36.00
Apr 25, 2025 Stephens & Co. Matt Olney Overweight Maintains $39.00
Apr 2, 2025 Raymond James Michael Rose Market Perform Downgrade $N/A
Jan 29, 2025 Keefe, Bruyette & Woods Wood Lay Market Perform Downgrade $42.00
Jan 24, 2025 Raymond James Michael Rose Outperform Reiterates $39.00
Jan 23, 2025 Stephens & Co. Matt Olney Overweight Reiterates $42.00
Jul 29, 2024 Keefe, Bruyette & Woods Wood Lay Outperform Reiterates $28.00
Jul 29, 2024 Deutsche Bank Bernard von-Gizycki Hold Maintains $26.00
Jan 29, 2024 Raymond James Michael Rose Outperform Maintains $22.00
Jan 11, 2024 Keefe, Bruyette & Woods Brady Gailey Outperform Initiates $26.00
Oct 27, 2023 Stephens & Co. Matt Olney Overweight Maintains $20.00
Oct 27, 2023 Raymond James Michael Rose Outperform Maintains $20.00
Jul 28, 2023 Stephens & Co. Matt Olney Overweight Maintains $24.00
Jul 28, 2023 Raymond James David Long Outperform Upgrade $23.00

Third Coast Bancshares, Inc. (TCBX) Competitors

The following stocks are similar to Third Coast Bancshares based on their market capitalization and industry sector. These similar stocks potentially provide investors with alternative investment opportunities within the same market segment.

Third Coast Bancshares, Inc. (TCBX) Financial Data

Third Coast Bancshares, Inc. has a market capitalization of $638.46M with a P/E ratio of 9.9x. The company generates $212.93M in trailing twelve-month revenue with a 32.4% profit margin.

Revenue growth is +25.6% quarter-over-quarter, while maintaining an operating margin of +34.2% and return on equity of +12.2%.

Valuation Metrics

Market Cap $638.46M
Enterprise Value $362.70M
P/E Ratio 9.9x
PEG Ratio 0.7x
Price/Sales 3.0x

Growth & Margins

Revenue Growth (YoY) +25.6%
Gross Margin N/A
Operating Margin +34.2%
Net Margin +32.4%
EPS Growth +20.5%

Financial Health

Cash/Price Ratio +68.0%
Current Ratio N/A
Debt/Equity 0.3x
ROE +12.2%
ROA +1.2%
๐Ÿ’ก SKIP THE NOISE

97% of Analyst Ratings Go Nowhere

We filter thousands of calls to find the few that actually matter. Get the top analyst buy ratings โ€” tracked and updated every Monday and Thursday.

Join 5,000+ investors getting our data-driven analysis. Unsubscribe anytime.

Third Coast Bancshares, Inc. logo

Third Coast Bancshares, Inc. (TCBX) Business Model

About Third Coast Bancshares, Inc.

What They Do

Provides comprehensive commercial banking solutions.

Business Model

The company operates as a bank holding company, primarily generating revenue through a suite of commercial banking services tailored for small and medium-sized businesses, as well as professionals. It earns income from various deposit products, fees for banking services, and interest from its investment portfolio, including state and municipal securities and corporate bonds.

Additional Information

Third Coast Bancshares focuses its operations in the largest metropolitan areas of Texas, contributing to local economic growth. The company is committed to stable growth and offers a diversified range of services, including online and mobile banking, treasury management, and merchant services.

Company Information

Sector

Financial Services

Industry

Banks - Regional

Employees

514

CEO

Mr. Bart O. Caraway CPA

Country

United States

IPO Year

2021

Third Coast Bancshares, Inc. (TCBX) Latest News & Analysis

Latest News

TCBX stock latest news image
Quick Summary

Third Coast Bancshares, Inc. (TCBX) held its Q1 2026 earnings call, providing insights into financial performance and strategic initiatives. Details on earnings and future outlook were discussed.

Why It Matters

Third Coast Bancshares' Q1 2026 earnings reveal financial performance and outlook, impacting stock valuation and investor sentiment. Key metrics may influence investment decisions.

Source: Seeking Alpha
Market Sentiment: Neutral
TCBX stock latest news image
Quick Summary

Third Coast Bancshares, Inc. (NYSE: TCBX) reported Q1 2026 net income of $16.4M ($1.03 EPS), down from $17.9M in Q4 2025, largely due to $3.3M in merger-related expenses.

Why It Matters

Third Coast Bancshares' declining net income and rising merger expenses may signal operational challenges, impacting future earnings and investor confidence.

Source: Newsfile Corp
Market Sentiment: Neutral
TCBX stock latest news image
Quick Summary

Third Coast Bancshares completed its merger with Keystone Bancshares on February 1, 2026, adding $812 million in loans, $1 billion in assets, and $844.2 million in deposits.

Why It Matters

The merger enhances Third Coast's financial position, increasing assets and deposits, which may lead to improved earnings and growth potential, positively influencing stock performance.

Source: PRNewsWire
Market Sentiment: Neutral
TCBX stock latest news image
Quick Summary

Third Coast Bancshares, Inc. (TCBX) reported Q3 earnings of $0.88 per share, surpassing estimates of $0.84 and improving from $0.78 per share year-over-year.

Why It Matters

Third Coast Bancshares' quarterly earnings beat estimates and show year-over-year growth, indicating strong performance and potential for future profitability, which can positively influence stock prices.

Source: Zacks Investment Research
Market Sentiment: Positive
TCBX stock latest news image
Quick Summary

Third Coast Bancshares, Inc. (NYSE: TCBX) will report Q1 2026 financial results on April 22, 2026, after market close, followed by a conference call on April 23 at 11:00 a.m. ET.

Why It Matters

The upcoming financial results and conference call of Third Coast Bancshares could influence investor sentiment and stock performance, offering insights into the company's performance and future outlook.

Source: PRNewsWire
Market Sentiment: Neutral
TCBX stock latest news image
Quick Summary

Third Coast Bancshares, Inc. has declared a quarterly cash dividend of $16.875 per share on its 6.75% Series A Convertible Preferred Stock, payable April 15, 2026, to shareholders recorded by March 31, 2026.

Why It Matters

The declaration of a quarterly cash dividend signals financial health and stability, potentially attracting income-focused investors and affecting stock price positively.

Source: PRNewsWire
Market Sentiment: Neutral

Frequently Asked Questions About TCBX Stock

What is Third Coast Bancshares, Inc.'s (TCBX) stock forecast for 2026?

Based on our analysis of 9 Wall Street analysts, Third Coast Bancshares, Inc. (TCBX) has a median price target of $43.00. The highest price target is $45.00 and the lowest is $40.00.

Is TCBX stock a good investment in 2026?

According to current analyst ratings, TCBX has 2 Buy ratings, 2 Hold ratings, and 0 Sell ratings. The stock is currently trading at $38.48. Always conduct your own research and consider your investment goals before making investment decisions.

What is the long-term price prediction for TCBX stock?

Wall Street analysts predict TCBX stock could reach $43.00 in the next 12 months. This represents a 11.7% increase from the current price of $38.48. Please note that this is a projection by Wall Street analysts and not a guarantee.

What is Third Coast Bancshares, Inc.'s business model?

The company operates as a bank holding company, primarily generating revenue through a suite of commercial banking services tailored for small and medium-sized businesses, as well as professionals. It earns income from various deposit products, fees for banking services, and interest from its investment portfolio, including state and municipal securities and corporate bonds.

What is the highest forecasted price for TCBX Third Coast Bancshares, Inc.?

The highest price target for TCBX is $45.00 from at , which represents a 16.9% increase from the current price of $38.48.

What is the lowest forecasted price for TCBX Third Coast Bancshares, Inc.?

The lowest price target for TCBX is $40.00 from at , which represents a 4.0% increase from the current price of $38.48.

What is the overall TCBX consensus from analysts for Third Coast Bancshares, Inc.?

The overall analyst consensus for TCBX is neutral. Out of 9 Wall Street analysts, 2 rate it as Buy, 2 as Hold, and 0 as Sell, with a median price target of $43.00.

How accurate are TCBX stock price projections?

Stock price projections, including those for Third Coast Bancshares, Inc., are based on various factors including financial models, market conditions, and analyst forecasts. While these predictions provide valuable insights, they should be considered alongside your own research and risk tolerance.

Important Disclaimer

The information provided by Ticker Nerd is for educational and informational purposes only. It should not be considered financial or investment advice. Past performance is not indicative of future results. Always conduct your own research and consult with a qualified financial advisor before making any investment decisions. Analyst ratings and price forecasts are sourced from Wall St analysts and other experts. These projections are speculative and do not guarantee future stock performance.

Last updated: May 9, 2026 2:33 PM UTC
Serious About Growing Your Portfolio?

We highlight 2 high-upside stocks each month – no fluff.

Missedย NVDA?
Donโ€™t Miss the Next One.

Join 5,000+ investors using Ticker Nerd’s Market Radar to stay ahead of major market moves, analyst upgrades, and trending opportunities โ€” for free.