
TVRD Stock Forecast: Tvardi Therapeutics, Inc. Price Predictions for 2026-2027
The median 12-month analyst price target for Tvardi Therapeutics, Inc. is $9. Ticker Nerd's systematic factor model, run across ~4,300 US stocks, ranks it 30 of 100 as at 21 Nov 2026 — in the lower half.
One number for the whole business
Consensus tells you what everyone already believes. The model scores Tvardi Therapeutics, Inc. on its factor families — the same systematic rank behind the Ticker Nerd portfolio.
Percentile across ~4,300 US stocks on Ticker Nerd’s systematic factor model. Higher is better. How the model is built and tested
Revisions (55): Analysts have, on balance, been raising their forecasts.
Value (18): The shares cost a lot relative to the profits and assets behind them.
Built and run by Aslam Ghouse, an ex-Goldman Sachs systematic trader with 15+ years in markets.
TVRD stock forecast 2026-2027: analyst price targets & predictions
The bullish and bearish analyst opinions on TVRD, reported as data — targets and ratings, the market's view beside the model's.
Price targets and ratings are third-party analyst estimates, reported here as data. They are not Ticker Nerd forecasts, and they are frequently wrong.
Data provided by Twelve Data
| Date | Firm | Action | Rating | Target |
|---|---|---|---|---|
| 20 Nov 2026 | HC Wainwright & Co. | Reiterates | Buy | $9.00 |
| 18 Nov 2026 | Oppenheimer | Maintains | Outperform | $10 → $9.00 |
| 20 Oct 2026 | Chardan Capital | Initiates | Buy | $8.00 |
| 8 Sept 2026 | LUCID CAPITAL MARKETS | Assumes | Buy | $14 |
| 30 July 2026 | BTIG | Maintains | Buy | $15 → $5.00 |
| 8 July 2026 | Raymond James | Upgrade | Outperform | $10 |
| 7 July 2026 | BTIG | Reiterates | Buy | $15 |
| 8 June 2026 | HC Wainwright & Co. | Initiates | Buy | — |
| 20 Apr 2026 | Barclays | Downgrade | Underweight | — |
| 1 Apr 2026 | Barclays | Maintains | Equal-Weight | — |
| 1 Apr 2026 | BTIG | Reiterates | Buy | — |
| 1 Apr 2026 | Piper Sandler | Maintains | Neutral | — |
| 14 Oct 2025 | Raymond James | Downgrade | Market Perform | — |
| 13 Oct 2025 | Barclays | Initiates | Overweight | — |
| 13 Oct 2025 | BTIG | Maintains | Buy | — |
| 14 July 2025 | Raymond James | Initiates | Outperform | — |
| 11 July 2025 | Cantor Fitzgerald | Initiates | Overweight | — |
| 12 June 2025 | Piper Sandler | Initiates | Overweight | — |
| 21 May 2025 | Oppenheimer | Initiates | Outperform | — |
| 28 Apr 2025 | Jones Trading | Initiates | Buy | — |
Price targets and ratings are third-party analyst estimates, reported here as data. They are not Ticker Nerd forecasts, and they are frequently wrong.
Wall Street targets run 12 to 18 months out. No analyst publishes a 2030 price target for TVRD.
This page is one stock. Monday covers all of them.
TVRD appears in the Radar on the weeks it earns a place.
- Market Radar, every Monday: the week's biggest rank moves across ~4,300 US stocks, and the reason for each.
- The AI build-out map, free: every AI company we track on one page, with the model's Top picks in all four parts.
AI cloud capacity
MSFTAMZNGOOGLORCL
AI chips
NVDAAVGOAMDMU
AI networking and servers
ANETDELLLITECRDO
Data centre power
VRTCEGGEVVST
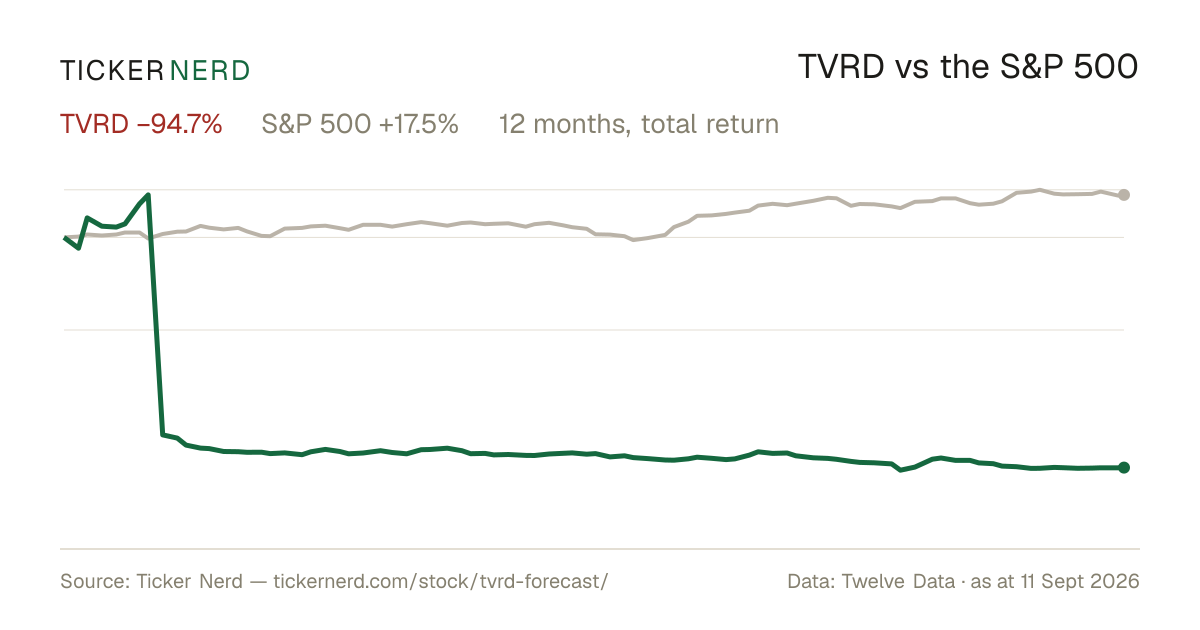
TVRD vs the S&P 500
Both lines are total return — dividends reinvested — so the comparison is honest on both sides.
Over the twelve months to 20 Nov 2026, Tvardi Therapeutics, Inc. returned −73.8% against +6.9% for the S&P 500, dividends included.
Download this chart as an image — free to reuse; link this page as the source.
Data provided by Twelve Data
TVRD analyst estimate revisions
Not the forecast itself — the direction analysts are revising it. Revision direction is one of the model's factor families.
Financials
A margin means little on its own. Each bar marks where the figure sits across the whole US universe we score.
- Trailing P/E
- —
- Price / sales
- —
- Price / book
- 0.4×
- EV / EBITDA
- —
Cheaper than 88% of US stocks
- Revenue growth (YoY)
- —
- Earnings growth (YoY)
- —
- Gross margin
- —
- Operating margin
- —
- Net margin
- —
- Return on equity
- −126.2%
- Return on assets
- −55.5%
- Dividend yield
- —
Higher than 11% of US stocks
Higher than 7% of US stocks
Bars mark the percentile across the ~4,300 US stocks Ticker Nerd covers, among those reporting the figure.
Key statistics
The headline figures, each with its date. Every row carries its own link — cite it straight from here.
Tvardi Therapeutics, Inc. has a market value of $13.2M and an enterprise value of $120K.
Revenue in the twelve months to 30 June 2026: $0.0.
Net income over the same four quarters: −$26.1M.
Diluted earnings per share, trailing twelve months: −$2.79.
Free cash flow in the twelve months to 30 June 2026: −$25.0M.
Tvardi Therapeutics, Inc. employs 12 people.
Data provided by Twelve Data
TVRD and its peers
The nearest names by industry and size, scored by the same model — like for like.
Take a look at TVRD’s peer groups, ranked by the model: healthcare stocks · biotech stocks.
Look up any of the roughly 4,300 stocks we score.
The rank is the raw material. Whether the rules would actually own Tvardi Therapeutics, Inc. — and when they’d sell — is the membership. See the Ticker Nerd 20 →
Questions about TVRD
What is the TVRD stock price forecast for 2026-2027?
The median 12-month analyst price target for Tvardi Therapeutics, Inc. is $9, with estimates ranging from $3 to $14. These are third-party analyst estimates, not Ticker Nerd forecasts, and they are frequently wrong.
Is TVRD stock a buy right now?
Of the 9 analysts covering Tvardi Therapeutics, Inc., 7 rate it a Buy, 1 a Hold and 1 a Sell. Ticker Nerd's systematic factor model ranks Tvardi Therapeutics, Inc. 30 out of 100 across roughly 4,300 US stocks as at 21 Nov 2026. None of this is personal advice — it does not consider your circumstances.
How does Ticker Nerd's model rank TVRD?
As at 21 Nov 2026, Tvardi Therapeutics, Inc. ranks 30 out of 100 on Ticker Nerd's systematic factor model — a percentile across roughly 4,300 US stocks, built from its factor families. Its strongest factor family is Revisions (55 of 100).
Will TVRD stock go up?
No one can know that. What the data says: the median 12-month target from 9 analysts is $9, and Ticker Nerd's factor model ranks Tvardi Therapeutics, Inc. 30 out of 100 as at 21 Nov 2026. Analyst targets are third-party estimates and frequently wrong; none of this is personal advice.
What is the TVRD stock forecast for 2030?
No analyst covering Tvardi Therapeutics, Inc. publishes a 2030 price target — Wall Street targets run 12 to 18 months out. Sites quoting a 2030 price for TVRD are extrapolating price history, which says nothing about the business. The furthest attributed numbers are the current analyst targets: $3 to $14 over the next 12 months.
How has TVRD stock performed over the past year?
Tvardi Therapeutics, Inc. returned -73.8% over the 12 months to 20 Nov 2026, with dividends reinvested. Past performance does not indicate future returns.
What does Tvardi Therapeutics, Inc. do?
Tvardi Therapeutics, Inc. is a clinical-stage biopharmaceutical company focused on developing oral, small-molecule therapies that target STAT3, a signaling pathway associated with inflammatory and proliferative diseases. The company’s current pipeline includes TTI-101, which is being studied for fibrosis-driven diseases such as idiopathic pulmonary fibrosis and hepatocellular carcinoma, and TTI-109, a next-generation oral STAT3 inhibitor in early clinical development.
About Tvardi Therapeutics, Inc.
Tvardi Therapeutics, Inc. is a clinical-stage biopharmaceutical company focused on developing oral, small-molecule therapies that target STAT3, a signaling pathway associated with inflammatory and proliferative diseases. The company’s current pipeline includes TTI-101, which is being studied for fibrosis-driven diseases such as idiopathic pulmonary fibrosis and hepatocellular carcinoma, and TTI-109, a next-generation oral STAT3 inhibitor in early clinical development. Tvardi Therapeutics concentrates on conditions with significant unmet medical need, positioning its research around disease areas where targeted therapies may address complex biological pathways. Based in Sugar Land, Texas, Tvardi Therapeutics serves the biotechnology market through a pipeline centered on precision, mechanism-based drug development.
CEO Dr. Imran Alibhai Ph.D. · 12 employees · United States · https://tvarditherapeutics.com