XPOXPOIndustrials · Trucking

XPO Stock Forecast: XPO, Inc. Price Predictions for 2026-2027

Last close, 11 Sept 2026
$182
−0.09% on the day

The 26 Wall Street analysts covering XPO, Inc. hold a median 12-month price target of $240 — +31.7% from the last close. Ticker Nerd's systematic factor model, run across ~4,600 US stocks, ranks it 90 of 100 as at 12 Sept 2026 — among the strongest tenth. Here, the model and the Street point the same way.

Market cap
$21.3B
Ticker Nerd rank
90 / 100
Median analyst target
$240
Analysts covering
26
Revenue$2.4B+13.2% y/y
Operating income$290.0M
Net income$162.0M
Free cash flow$181.0M
Quarterly, 8 quarters to 30 June 2026 · latest quarter's figure shown
Total return, dividends reinvested
1W
−1.4%
1M
−10.4%
YTD
+34.0%
1Y
+35.6%
From 52W high
−20.2%
From 52W low
+47.3%
$124
$228
52-week range, adjusted closes · the dot is the last close
Ticker Nerd rank

XPO stock analysis: one number for the whole business

Consensus tells you what everyone already believes. The model scores XPO, Inc. on its factor families — the same systematic rank behind the Ticker Nerd portfolio.

Where the model ranks itAs at 12 Sept 2026
90 / 100

Percentile across ~4,600 US stocks on Ticker Nerd’s systematic factor model. Higher is better. How the model is built and tested

Revisions
96
Issuance
89
Quality
87
Momentum
80
Accruals
75
Growth
63
Value
45
Volatility
34
Size
10

Revisions (96): Analysts have, on balance, been raising their forecasts.

Volatility (34): The share price moves around a lot.

Size (10): Larger than most of the companies we track — more scrutinised, less often mispriced.

Built and run by Aslam Ghouse, an ex-Goldman Sachs quant trader with fourteen years in markets.

Wall Street

XPO stock forecast 2026-2027: analyst price targets & predictions

The bullish and bearish analyst opinions on XPO, reported as data — targets and ratings, the market's view beside the model's.

Share price and the analyst range, 12 monthsAdjusted close, US dollars
$100$150$200$250$300Oct 25Jan 26Apr 26Jul 26XPOHigh $275Median $240Low $115

Price targets and ratings are third-party analyst estimates, reported here as data. They are not Ticker Nerd forecasts, and they are frequently wrong.

Data provided by Twelve Data

What Wall Street says26 analysts
20 Buy4 Hold2 Sell
Low $115Median $240High $275

The green dot is the last close — the median target sits +31.7% from it.

Recent analyst actionsNewest first

Of the 20 most recent actions, 5 moved their price target up and 5 moved it down.

DateFirmActionRatingTarget
10 Sept 2026BernsteinInitiatesOutperform$244
8 Sept 2026CitigroupMaintainsNeutral$221$220
4 Sept 2026B of A SecuritiesMaintainsBuy$248$228
31 July 2026CitigroupMaintainsNeutral$226$221
31 July 2026CitigroupMaintainsNeutral
31 July 2026OppenheimerMaintainsOutperform$236$238
31 July 2026OppenheimerMaintainsOutperform
31 July 2026Stephens & Co.MaintainsOverweight
31 July 2026Stephens & Co.MaintainsOverweight$255$270
31 July 2026TD CowenMaintainsBuy
31 July 2026TD CowenMaintainsBuy$224$228
21 July 2026StifelMaintainsBuy
21 July 2026StifelMaintainsBuy$237$241
15 July 2026CitizensInitiatesMarket Perform
14 July 2026SusquehannaMaintainsNeutral
14 July 2026SusquehannaMaintainsNeutral$212$214
13 July 2026Raymond JamesMaintainsOutperform$233$225
13 July 2026Raymond JamesMaintainsOutperform
9 July 2026CitigroupMaintainsNeutral$236$226

Price targets and ratings are third-party analyst estimates, reported here as data. They are not Ticker Nerd forecasts, and they are frequently wrong.

Market Radar

This page is one stock. Monday covers all of them.

Computed off the Friday close and sent before the US open.

Market Radar reports the week’s largest rank changes across roughly 4,600 US stocks, the factor behind each one, and where the market went. XPO appears on the weeks it earns a place.

Free, every Monday. Unsubscribe any time.

Performance

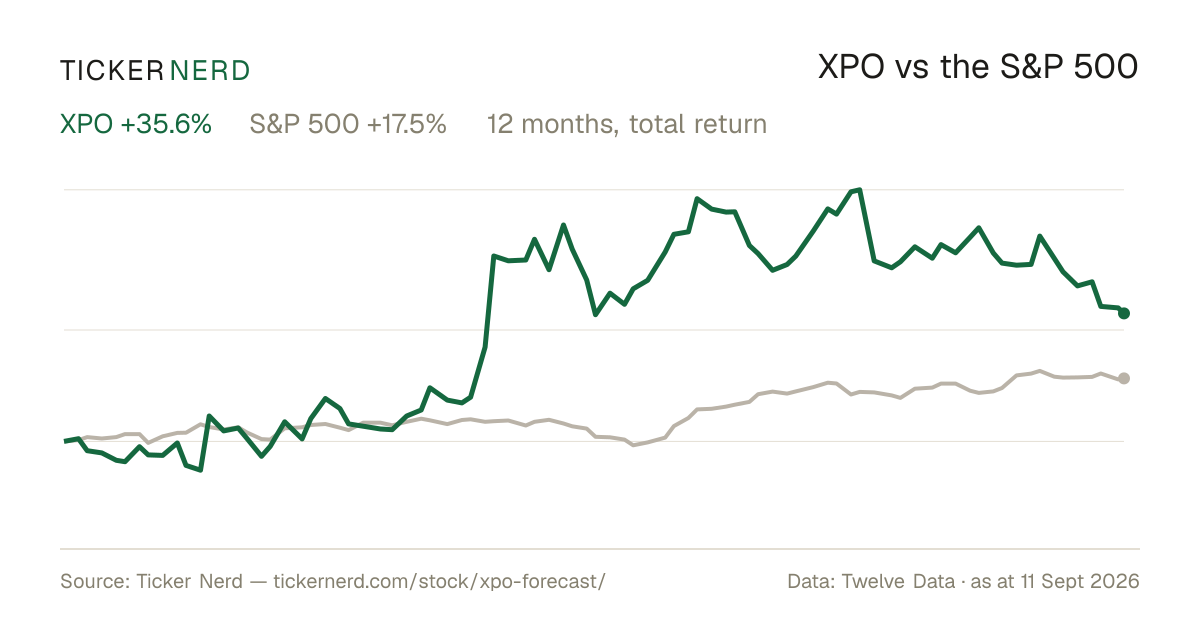
XPO vs the S&P 500

Both lines are total return — dividends reinvested — so the comparison is honest on both sides.

Over the twelve months to 11 Sept 2026, XPO, Inc. returned +35.6% against +17.5% for the S&P 500, dividends included.

XPO vs S&P 500, last 12 monthsTotal return, rebased to 100
80100120140160180Oct 25Jan 26Apr 26Jul 26XPOS&P 500

Download this chart as an image — free to reuse; link this page as the source.

Data provided by Twelve Data

Estimates

XPO analyst estimate revisions

Not the forecast itself — the direction analysts are revising it. Revision direction is one of the model's factor families.

Which way the estimates are movingNext fiscal year
EPS revision, 90 days
+11.2%
Analysts raising
24
Analysts cutting
0
Fundamentals

XPO, Inc. (XPO) financial data

A margin means little on its own. Each bar marks where the figure sits across the whole US universe we score.

Valuation
Trailing P/E
53.7×

Cheaper than 13% of US stocks

Price / sales
2.5×

Cheaper than 47% of US stocks

Price / book
10.9×

Cheaper than 9% of US stocks

EV / EBITDA
18.2×

Cheaper than 17% of US stocks

Growth & margins
Revenue growth (YoY)
13.2%

Higher than 59% of US stocks

Earnings growth (YoY)
52.8%

Higher than 75% of US stocks

Gross margin
14.9%

Higher than 14% of US stocks

Operating margin
12.3%

Higher than 68% of US stocks

Net margin
4.7%

Higher than 59% of US stocks

Returns & dividend
Return on equity
21.6%

Higher than 82% of US stocks

Return on assets
6.4%

Higher than 83% of US stocks

Dividend yield

Bars mark the percentile across the ~4,600 US stocks Ticker Nerd covers, among those reporting the figure.

Key statistics

XPO, Inc. (XPO) statistics: revenue, profit & scale

The headline figures, each with its date. Every row carries its own link — cite it straight from here.

  • XPO, Inc. has a market value of $21.3B and an enterprise value of $25.1B.

  • Revenue in the twelve months to 30 June 2026: $8.6B. The latest quarter grew 13.2% year on year.

  • Net income over the same four quarters: $404.0M, a 4.7% net margin.

  • Diluted earnings per share, trailing twelve months: $3.39.

  • Free cash flow in the twelve months to 30 June 2026: $588.0M.

  • XPO, Inc. spent $215.0M on share buybacks in the twelve months to 30 June 2026.

  • Shares outstanding: 117.1M.

  • Trailing P/E: 53.7×; forward P/E: 28.1× — the forward figure prices analyst consensus estimates, not reported earnings.

  • XPO, Inc. employs 38,000 people $226K of revenue per employee.

Statement figures: company filings via Twelve Data, four quarters to 30 June 2026 · market figures as at 14 Sept 2026

Data provided by Twelve Data

Peers

XPO vs competitors

The nearest names by industry and size, scored by the same model — like for like.

Its peer group, ranked by the same modelTrucking
CompanyMarket capTKN rank
XPOXPO, Inc.$21.3B
90
ODFLOld Dominion Freight Line, Inc.$37.4B
84
KNXKnight-Swift Transportation Holdings, Inc.$11.1B
74
SAIASaia, Inc.$9.4B
53
SNDRSchneider National, Inc.$6.0B
91
RXORXO, Inc.$3.2B
72
ARCBArcBest Corp.$3.0B
91

Look up any of the roughly 4,600 stocks we score.

The rank is the raw material. Whether the rules would actually own XPO, Inc. — and when they’d sell — is the membership. See the Ticker Nerd 20 →

News

Latest XPO news & analysis

XPO (XPO) Upgraded to Strong Buy: Here's What You Should Know

Zacks Investment Research · 11 Sept 2026positive

XPO (XPO) has been upgraded to a Zacks Rank #1 (Strong Buy), reflecting growing optimism about the company's earnings prospects. The upgrade could drive the stock higher in the near term.

Why it matters — A Strong Buy upgrade signals increased confidence in XPO's earnings outlook, which could influence investor sentiment toward the stock.

Trucking Stocks Have Been Pummeled but Wall Street Sees Four to Buy

Barrons · 10 Sept 2026positive

A Barron's article reports on four trucking stocks Wall Street sees as buys after the sector has been pummeled, including XPO. It notes that tightening trucking capacity and improving freight rates could outweigh the impact of soaring diesel prices for these companies.

Why it matters — A XPO watcher would care because the piece identifies XPO as one of the trucking names Wall Street views favorably amid improving freight conditions.

XPO Schedules Third Quarter 2026 Earnings Conference Call for Thursday, October 29, 2026

GlobeNewsWire · 9 Sept 2026neutral

XPO announced it will hold its third quarter 2026 earnings conference call and webcast on Thursday, October 29 at 8:30 a.m. Eastern Time. The company's results will be released earlier that morning and posted on www.xpo.com.

Why it matters — XPO watchers will know exactly when to expect the company's third-quarter financial results and earnings discussion.

XPO Provides North American LTL Operating Data for August 2026

GlobeNewsWire · 3 Sept 2026neutral

XPO reported preliminary less-than-truckload (LTL) segment operating metrics for August 2026. The company, a leading North American freight transportation provider, released the data in a statement from Greenwich, Connecticut.

Why it matters — The monthly LTL operating data offers XPO watchers an early look at the company's recent freight segment performance.

Three XPO Drivers Earn Top Awards at 2026 National Truck Driving Championships

GlobeNewsWire · 18 Aug 2026positive

XPO announced that three of its drivers earned top honors at the 2026 National Truck Driving Championships. Chris Poynor of Pasco, Washington, placed first in the 3-Axle class, and two other XPO drivers also earned podium spots.

Why it matters — The recognition highlights the skill and safety record of XPO's drivers, reflecting positively on the company's workforce and operations.

FAQ

Frequently asked questions about XPO stock

What is the XPO stock price forecast for 2026-2027?

The 26 Wall Street analysts covering XPO, Inc. have a median 12-month price target of $240, with estimates ranging from $115 to $275. These are third-party analyst estimates, not Ticker Nerd forecasts, and they are frequently wrong.

Is XPO stock a buy right now?

Of the 26 analysts covering XPO, Inc., 20 rate it a Buy, 4 a Hold and 2 a Sell. Ticker Nerd's systematic factor model ranks XPO, Inc. 90 out of 100 across roughly 4,600 US stocks as at 12 Sept 2026. None of this is personal advice — it does not consider your circumstances.

How does Ticker Nerd's model rank XPO?

As at 12 Sept 2026, XPO, Inc. ranks 90 out of 100 on Ticker Nerd's systematic factor model — a percentile across roughly 4,600 US stocks, built from its factor families. Its strongest factor family is Revisions (96 of 100).

Will XPO stock go up?

No one can know that. What the data says: the median 12-month target from 26 analysts implies +31.7% from the last close, and Ticker Nerd's factor model ranks XPO, Inc. 90 out of 100 as at 12 Sept 2026. Analyst targets are third-party estimates and frequently wrong; none of this is personal advice.

What is the XPO stock forecast for 2030?

No analyst covering XPO, Inc. publishes a 2030 price target — Wall Street targets run 12 to 18 months out. Sites quoting a 2030 price for XPO are extrapolating price history, which says nothing about the business. The furthest attributed numbers are the current analyst targets: $115 to $275 over the next 12 months.

How has XPO stock performed over the past year?

XPO, Inc. returned +35.6% over the 12 months to 11 Sept 2026, with dividends reinvested. Past performance does not indicate future returns.

What does XPO, Inc. do?

XPO, Inc. is a transportation and logistics company focused on asset-based less-than-truckload freight services in North America.

What is the latest news on XPO?

The most recent item we track (Zacks Investment Research, 11 Sept 2026): "XPO (XPO) Upgraded to Strong Buy: Here's What You Should Know". XPO (XPO) has been upgraded to a Zacks Rank #1 (Strong Buy), reflecting growing optimism about the company's earnings prospects. The upgrade could drive the stock higher in the near term.

Company

About XPO, Inc.

XPO, Inc. is a transportation and logistics company focused on asset-based less-than-truckload freight services in North America. The company helps businesses move large and time-sensitive shipments through a network of owned trucks, terminals, and service centers, supported by proprietary technology designed to improve routing, visibility, and operational efficiency. XPO serves a wide range of customers across consumer, trade, and industrial markets, offering domestic and cross-border freight transportation into the United States, Canada, Mexico, and the Caribbean. Its business is centered on freight movement that requires flexible handling, coordinated delivery, and dense network coverage, making it an important provider within the commercial shipping and supply chain market. XPO is headquartered in Greenwich, Connecticut.

CEO Mr. Mario A. Harik · 38,000 employees · United States · https://www.xpo.com