TipRanks Review (2026): Is Premium Worth $359 a Year?
Basic is free, Premium is $359 a year and Ultimate is $599. TipRanks ranks every Wall Street analyst by past accuracy. Where that helps and where it stops.
 By Aslam Ghouse, CFA · Ex-Goldman Sachs systematic trader · Updated 16 Sept 2026
- Our rating
- 4.0 / 5
- Refund
- 30-day money-back on yearly plans bought on the website; none on app-store purchases.
- Best for
- Investors who act on analyst ratings and want to know whose ratings have been right.
We earn a commission if you subscribe through this link, at no extra cost to you. It has no bearing on what the model ranks or what we cover.
Some links in this article are affiliate links. How we get paid · How we review.
TipRanks tracks the ratings of tens of thousands of Wall Street analysts. It scores each one on success rate and average return per call, on every rating since January 2009. Premium costs $359 a year, Ultimate $599, and the Basic tier is free (prices checked September 2026).
My take: TipRanks is the only research tool that answers the question every price target raises: has this analyst been right before? If analyst ratings already drive your decisions, Premium earns its price. If you hold index funds, screen for yourself, or buy small companies that no analyst covers, it has little to sell you.
On a trading desk an analyst's calls were judged by two numbers: hit rate and average return per call. Those are the two numbers TipRanks publishes for every analyst.
A ranking of analysts cannot tell you whether the next call will work, or whether the stock would have risen anyway. It also says nothing about the thousands of companies analysts do not cover.
What TipRanks is
TipRanks was founded in 2012 by Uri Gruenbaum after he lost $20,000 following a bad tip. Prytek bought it for about $200 million in August 2024. Its data engine reads published analyst notes, SEC filings and financial blogs. It ties each rating to a named person and measures what happened next.
Every stock page shows the analyst consensus, meaning the combined view of every analyst covering the stock, and the average price target. It also shows insider and hedge-fund positions, the tone of the news coverage and a 1-to-10 Smart Score. The paid tiers let you filter all of that down to the analysts who have been right most often.
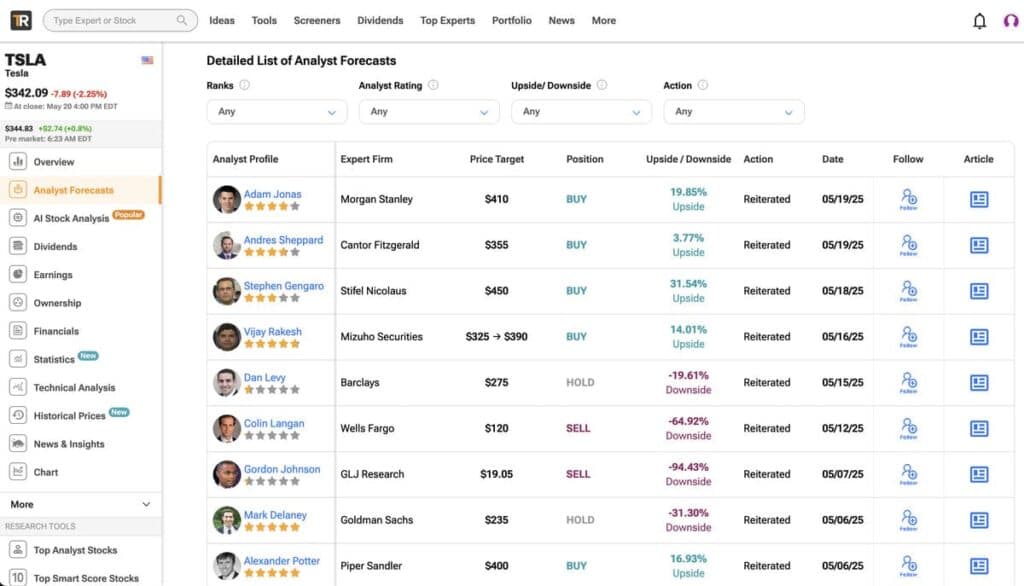
Analyst forecasts: each price target arrives with the forecaster's success rate and average return. Source: TipRanks.
TipRanks cost (2026): Basic, Premium and Ultimate
Prices from TipRanks' own site, checked September 16, 2026. Both paid tiers bill once a year on the website. The "per month" figures TipRanks shows are the yearly price divided by twelve. There is no month-to-month web plan.
| Tier | Per month (shown) | Billed | Refund |
|---|---|---|---|
| Basic | $0 | Free | n/a |
| Premium | $29.95 | $359 a year | 30 days on the website |
| Ultimate | $49.95 | $599 a year | 30 days on the website |
Which tier suits whom:
- Basic is enough to see the consensus, the price target and who is buying. Start here for two weeks before paying anything.
- Premium is the right tier for most buyers. It has the top-analyst filter, the full Smart Score, daily expert insights, portfolio research, alerts on 30 stocks and PDF export.
- Ultimate adds the benchmark setting, which measures analysts against the S&P 500 or their sector instead of the raw stock move. It also adds research-firm rankings, the full expert rankings, unlimited alerts and CSV export. It is worth the extra $240 a year only if you will use the benchmark setting. That is the one feature that changes what the rankings say.
The discount: TipRanks' affiliate landing page advertises 70% off the first year for new members. The checkout shows the exact price before you pay. Treat the discount as a first-year price. Assume the renewal bills at list unless the checkout says otherwise.
Premium is $359 a year at list, with 30 days to claim a refund on a yearly plan bought on the website.
Is TipRanks worth it?
It depends on whether analyst ratings already play a part in how you invest.
If they do, Premium is worth $359. Take a price target from an analyst with a 38% success rate and a 25% average return per call. The same target from an analyst at 72% and 18% is a different piece of information. Nothing else sold to individuals makes that distinction. The top-analyst consensus filter alone changes the reading on many large companies.
If they do not, the Smart Score and the insider tracker are the only things left on the menu. Both have cheaper or free substitutes. Anyone running their own screens will get more from Stock Rover at a similar price. Anyone holding index funds needs none of it.
A second test: how many of your holdings have ten or more analysts covering them? Outside the largest few hundred US stocks the count drops fast. A ranking of analysts says nothing about a stock that has two.
How TipRanks calculates analyst accuracy
TipRanks built the method with Cornell University's finance department. It covers every rating TipRanks has recorded since January 2009. Three numbers go into each analyst's star rating.
- Success rate. Each Buy or Sell rating is scored as a win or a loss after one year, or sooner if the analyst changes the rating. A Hold closes any open position. A Sell closes an open Buy and opens a short, which is a bet that the price will fall. The figure is wins divided by all rated calls.
- Average return. The gain or loss on each rating over the same window, averaged across all of the analyst's calls. TipRanks states that this counts for more than the success rate. An analyst with a 60% hit rate and big winners ranks above one with 75% and small ones.
- Statistical significance. A statistical test (a Z-test) that weighs the two figures against the number of ratings. An analyst with 200 calls at a 65% success rate ranks above one with ten calls at 80%, because ten calls prove little.
By default there is no benchmark: each call is measured on the stock's own move alone. A Buy on a stock that rose 25% counts as a 25% win even if the sector rose 40%. Ultimate members can switch the benchmark to the S&P 500 or the sector ETF. That is the setting a professional would use. In a rising market it knocks a lot of analysts down the table.
Two caveats the method cannot fix. Analysts at brokers (the sell side) issue far more Buys than Sells, for reasons that have nothing to do with their view. So the sample is skewed before it is scored. And a one-year window measured over a long bull market flatters everyone. A high hit rate from 2020 to 2025 is not the same claim as a high hit rate through 2008 or 2022.
What you get with Premium
The paid tiers turn the same data into filters. The features that matter, with the tier that carries them:
- Top-analyst consensus (Premium). The consensus rating and price target, recomputed from the highest-ranked analysts only. This is the feature to pay for.
- Smart Score (full view on Premium). A 1-to-10 score built from eight inputs: analyst consensus, blogger opinion, insider activity, hedge-fund activity, news sentiment, technicals, fundamentals and crowd wisdom. TipRanks publishes a backtest, a test run on past prices, showing its 10-scored stocks ahead of the market. Its own disclaimer states that the figures are backtested and that no investor achieved them. Read it as a filter for ideas rather than a track record.
- Analyst, insider and hedge-fund trackers (Premium). Follow a named analyst and get an email when they rate a stock. See insider buys TipRanks flags as informative, separated from option exercises and scheduled sales. See hedge-fund holdings from their 13F filings, which update every quarter with a 45-day lag.
- Smart Portfolio (Premium). Import a portfolio and see its consensus rating, Smart Score and analyst activity in one place. Ultimate allows several portfolios.
- AI Stock Analysis (Premium). TipRanks' newest report: a generated page per stock that reads the filings, transcripts and technicals and produces a score and a price target. Useful as a first pass. The analyst data underneath is still the product.
- The app. iOS and Android, with the stock pages, alerts and portfolio. Buy the subscription on the website rather than in the app. App-store purchases get no refund from TipRanks, and the app reviews complain about pop-ups.
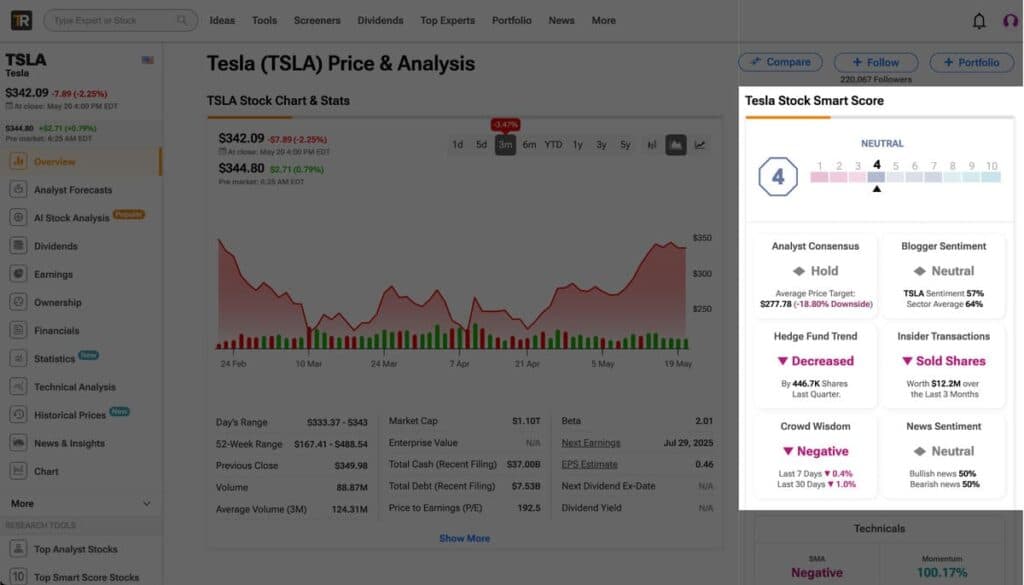
The Smart Score and its eight inputs. Source: TipRanks.
The top-analyst filter and the full Smart Score start on Premium, $359 a year at list.
Is TipRanks legit?
Yes. TipRanks has run since 2012 and was bought by Prytek in 2024 for about $200 million. It also sells its data to institutions through an API, alongside the consumer site. Its ratings come from published analyst notes and SEC filings. Each one is tied to a named analyst at a named firm, so you can check any rating against its source.
On Trustpilot it scores 4.2 from about 1,580 reviews: 81% five-star, 5% one-star. The complaints cluster in three places, and none of them is about the data.
- Renewals and cancelling. Several one-star reviews describe an auto-renewal they did not notice and a hard time finding their subscription status. The refund window is 30 days on yearly web plans, once per product in any 12 months. You cancel by emailing support, so put the renewal date in your diary.
- Support response times. The two-star reviews are mostly about slow replies. That matters because cancelling runs through support.
- The app. Pop-ups and freezes on older phones.
The data side of the product has held up. I have not seen a credible claim that TipRanks ties ratings to the wrong analysts on any scale. The method is published in enough detail to be checked.
TipRanks vs Seeking Alpha
The most searched comparison, and the two rate different things.
| TipRanks Premium | Seeking Alpha Premium | |
|---|---|---|
| What it rates | Analysts, by success rate and average return per call | Stocks, by quant grades on value, growth, profitability, momentum and estimate revisions |
| The core output | Top-analyst consensus and price target; Smart Score | Quant rating; contributor articles with a bull and a bear case |
| Opinion | Aggregated from Wall Street; no house view | Thousands of named contributors; no house view |
| Insiders and funds | Tracked, with informative buys flagged | Basic |
| Screening | On analyst and Smart Score data | On the quant grades |
| Price | $359 a year | $299 a year at list |
| Best for | Investors who act on analyst ratings | Investors who want a fundamental score and the argument |
Buy TipRanks if a price target is the thing you want to check. Buy Seeking Alpha if you want a score built from the company's own numbers and someone's written reasoning. The two overlap less than their prices suggest. An investor who reads both analyst notes and contributor articles could justify both.
Where TipRanks falls short
- Large companies only, in practice. The rankings are only as good as the number of ratings on a stock, and small companies have few or none. A stock with two analysts has no meaningful top-analyst consensus.
- The default benchmark flatters everyone. Raw return over one year in a bull market makes most analysts look good. The benchmark setting that fixes this is an Ultimate feature.
- Buy bias in the source data. Broker ratings skew to Buy for reasons tied to the broker's own business. TipRanks scores the calls it is given and cannot correct the mix.
- Annual billing only. No month-to-month web plan, and the 30-day refund is once per product in any 12 months.
- A lot on every page. Consensus, Smart Score, insiders, hedge funds, bloggers, news sentiment and technicals on one stock page. A first-time user needs a week to learn what to ignore.
- Cancelling goes through support. There is no self-serve cancel-and-refund flow. That is where the one-star reviews come from.
- The only tool that ranks every analyst by measured success rate and average return
- Method published, built with Cornell, measured on every rating since 2009
- Top-analyst consensus filter changes the reading on many large companies
- Insider trades separated into informative and routine
- 30-day money-back on yearly plans bought on the website
- Little to offer on stocks with fewer than ten analysts
- Default accuracy figures ignore the market; benchmarking needs Ultimate
- Smart Score performance is a backtest, by TipRanks' own disclaimer
- Annual billing only; cancelling and refunds go through support
- Dense stock pages with a real learning curve
TipRanks vs Ticker Nerd
Different jobs. TipRanks tells you which analysts to trust. Ticker Nerd runs a portfolio by published rules and tells you what it holds.
| TipRanks | Ticker Nerd | |
|---|---|---|
| What you get | Analyst rankings, consensus, Smart Score, insider and fund data | The Ticker Nerd 20 — a rules-run portfolio |
| Who decides | You, with analyst records as the input | Published rules over a ranked ~1,500-stock universe |
| Cadence | Always on, alerts on every rating | Reviewed every four weeks, plain-English brief per holding |
| Record | n/a — a ranking of other people's calls | On the join page: every trade, losers included |
| Price | $359 a year | $199 a year |
The short version: if you make the decisions and want to know whose research to trust, TipRanks is the tool. If you want the portfolio decided by a system and explained, that is what membership is. Checking the twenty names against the top-analyst consensus in TipRanks is a sensible way to use both.
Verdict: is TipRanks worth it in 2026?
Rating: 4 out of 5. TipRanks does one thing nobody else does, and it does it with a published method. It scores every Wall Street analyst on hit rate and average return per call. So a price target arrives with the forecaster's record attached. For an investor who acts on analyst ratings, that is worth $359 a year.
The missing star is for coverage and for the default settings. The rankings mean little on stocks with a handful of analysts. The accuracy figures ignore the market unless you pay for Ultimate and set the benchmark yourself. The Smart Score's headline performance is a backtest. Add annual-only billing and a cancel-by-email policy that produces most of the one-star reviews.
Buy it if analyst ratings and price targets are already part of how you decide, and your holdings are large enough to have ten or more analysts covering them.
Skip it if you hold index funds, screen for yourself, or buy small companies. Stock Rover is the better toolkit for the second group, and StockAnalysis.com covers the basic data at $79 a year.
Quick answers.
What is TipRanks?
TipRanks is a stock research site. It tracks the ratings of tens of thousands of Wall Street analysts, bloggers, hedge funds and company insiders. It then ranks each one by how their past calls worked out. Every stock page shows the consensus rating, price targets, insider trades and a 1-to-10 Smart Score. It runs on the web and in iOS and Android apps. It was founded in 2012, and Prytek bought it for about $200 million in 2024.
How much does TipRanks cost?
Prices checked on TipRanks' site in September 2026: Basic is free, Premium is $359 a year and Ultimate is $599 a year. Both paid plans bill once a year on the website. The $29.95 and $49.95 'per month' figures are the annual price divided by twelve. TipRanks' affiliate landing page advertises 70% off the first year for new members.
Is TipRanks worth it?
Yes if you already act on analyst ratings and price targets. TipRanks is the only tool that tells you whose ratings have been accurate. No if you hold index funds, invest by your own screens, or buy small companies that few analysts cover. Most buyers should take Premium. Ultimate adds benchmark settings, research-firm rankings and unlimited alerts, which few individuals use.
Is TipRanks legit and reliable?
Yes. TipRanks has operated since 2012. Its ratings come from published analyst notes and SEC filings, and its analyst ranking method was built with Cornell University's finance department. It scores 4.2 on Trustpilot from about 1,580 reviews, with 81% five-star and 5% one-star. The one-star reviews cluster on auto-renewal, cancelling and refund rules, so read the refund policy before paying.
How does TipRanks calculate analyst accuracy?
Three measures, on every rating since January 2009. Success rate: each Buy or Sell counts as a win or a loss after one year, or sooner if the analyst changes the rating. A Hold closes the position. Average return: the average gain or loss per rating over the same window. Statistical significance: a statistical test (a Z-test) that rewards analysts with many ratings. So a 70% hit rate over 200 calls ranks above 80% over ten. The default measures the raw stock move. Ultimate members can switch the benchmark to the S&P 500 or the sector ETF.
What do you get on the free TipRanks plan?
Basic is free. It shows each stock's consensus rating and price target, analyst and insider activity, and a limited view of the Smart Score. Alerts cover a handful of stocks, and there is no customer support. The paid tiers add the filter to top-rated analysts only, the full Smart Score, daily expert insights and portfolio research.
How do you cancel TipRanks, and is there a refund?
Yearly and multi-year plans bought on the TipRanks website carry a 30-day money-back guarantee. It also covers renewals and upgrades, once per product in any 12 months. Email support within 30 days to cancel or downgrade. Monthly plans and anything bought through the Apple or Google app stores get no refund from TipRanks. App-store subscriptions are cancelled through the store.
TipRanks or Seeking Alpha?
TipRanks rates the people who rate stocks. Seeking Alpha rates the stocks themselves, with computer-scored (quant) grades on value, growth, profitability, momentum and estimate revisions, plus thousands of contributor articles. Choose TipRanks if analyst ratings and price targets drive your decisions. Choose Seeking Alpha Premium, $299 a year at list, if you want a score built from the company's own numbers and a written argument. They overlap less than their prices suggest.
The market re-ranks every week. Monday's email says what moved.
Computed off the Friday close and sent before the US open.
Market Radar reports the week’s largest rank changes across roughly 4,600 US stocks, the factor behind each one, and where the market went.