12 Best Stock Research Websites and Analysis Tools (2026)
Twelve stock research websites and analysis tools compared. All have a free tier, two are free outright, and the cheapest paid plan is $79 a year.
 By Aslam Ghouse, CFA · Ex-Goldman Sachs systematic trader · Updated 16 Sept 2026
Some links in this article are affiliate links. How we get paid · How we review.
This list compares twelve stock research websites and analysis tools. Every one has a free tier, two are free outright, and the cheapest paid plan is $79 a year. Prices below are from each vendor's live plans page, checked September 2026. Where the annual headline hides the month-to-month rate, we show both. We use most of these tools in producing Ticker Nerd itself.
My take: run three tools and stop. StockAnalysis.com for the numbers, TradingView for the chart and Seeking Alpha for what other people think. Together they cost nothing to start and under $500 a year fully paid.
On a trading desk the terminal did four jobs. It held every filing and price series in one place. It drew the chart. It carried the brokers' opinions. And it showed the live order book, the list of every buy and sell order waiting in the market. The first three jobs are now split across the twelve tools below, most of them free. None of them does the fourth. For anyone who holds stocks for months rather than minutes, it is the job that matters least.
| Tool | Best for | Free tier | Paid from |
|---|---|---|---|
| StockAnalysis.com | Company data and financial history | Five years of statements, screener, ETF holdings, no account | $79 a year (Pro) |
| TradingView | Charts and technical screening | Full charting with capped indicators and alerts, ads | $12.95 a month billed annually |
| Seeking Alpha | Ratings and written research | Headlines, a limited number of articles, basic quotes | $299 a year, $269 first year (Premium) |
| Ticker Nerd (ours) | A rules-run portfolio, decided for you | Stock pages, factor scores, screener views | $199 a year |
| Stock Rover | Deep screening and comparison | Watchlists and a small metric set | $29 a month billed annually (Premium) |
| TipRanks | Analyst accountability | Consensus ratings, analyst and insider activity | $359 a year (Premium) |
| Simply Wall St | Visual first impression of a company | Five company reports a month | Premium, priced by region |
| Quiver Quantitative | Alternative data | Live data on the main datasets | $25 a month billed yearly |
| Yahoo Finance | Free news, quotes and portfolio tracking | Everything most people use | $7.95 a month billed yearly (Bronze) |
| Google Finance | The simplest portfolio tracker | All of it | Free only |
| Investopedia | Definitions and paper trading | All of it | Free only |
| The Motley Fool | Stock picks with a written reason | News and commentary | $199 a year (Stock Advisor) |
1. StockAnalysis.com: the data site to open first
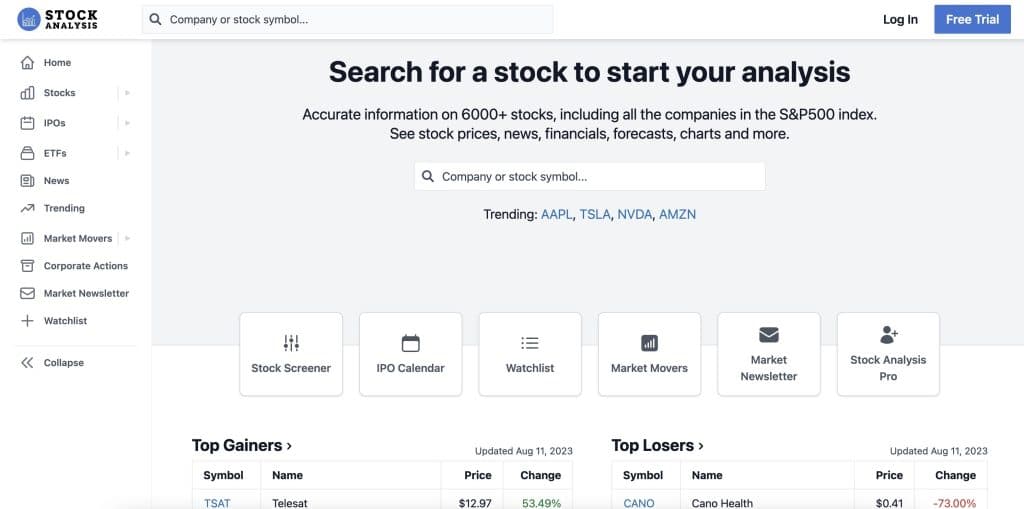
StockAnalysis.com is the first tab I open on any unfamiliar ticker. It covers 130,000+ stocks and funds with full financial statements, free and with no account. It also has a 317-filter screener, ETF holdings and the best IPO calendar around. It does one thing, company data, and does it faster than any site on this list.
The free tier stops at five years of history, shows ads and allows no downloads. Pro extends the statements to 10 to 40 years. That is the feature that matters: five years of numbers cannot show you how a business behaves through a boom and a slump. Unlimited adds unrestricted downloads, watchlists and alerts.
Pro is $79 a year or $9.99 month to month. Unlimited is $16.58 a month billed annually, about $199 a year. Both carry a 60-day money-back guarantee, checked September 2026.
It suits anyone who wants the reported numbers before anyone's opinion of them. There is no community, no research and no picks, by design. Our full StockAnalysis.com review covers where the data comes from.
2. TradingView: the best charts, free or paid
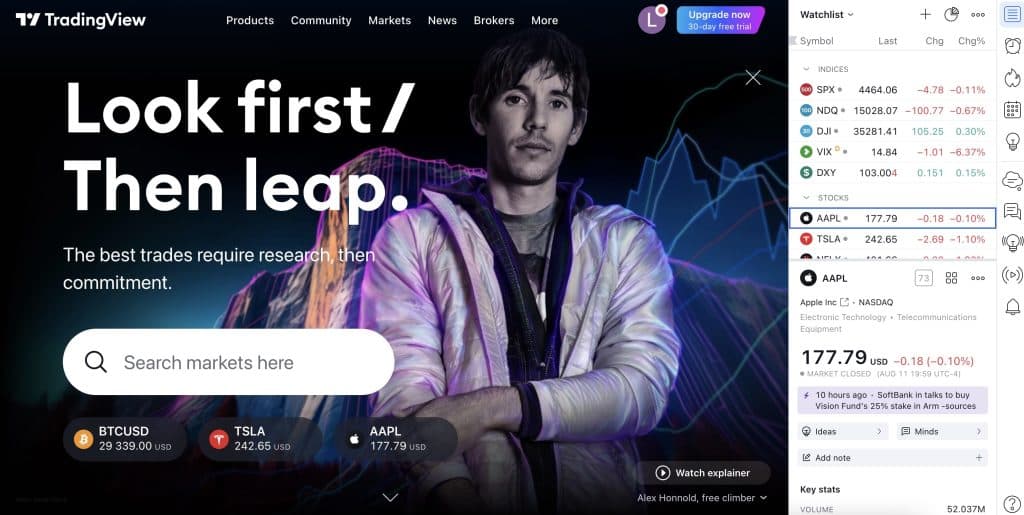
TradingView owns charting the way Google owns search. It has interactive charts for stocks, ETFs, forex and crypto. Its screener handles chart-based filters properly, and its alerts fire when they should. Pine Script, its own coding language, lets you write indicators and test them on past prices. Traders also publish their marked-up charts for others to read. Even if you never pay, the free charts beat most brokers' paid ones.
The free tier caps the number of indicators per chart and the number of alerts, and it shows ads. Essential raises the caps and removes the ads. Plus and Premium add more charts per layout, more alerts and chart intervals measured in seconds.
Essential is $12.95 a month billed annually or $14.95 month to month. Plus is $29.95 annual, $34.95 monthly. Premium is $59.95 annual, $69.95 monthly. Every paid plan starts with a 30-day free trial, checked September 2026.
It suits anyone who looks at a price chart more than once a week. The free tier suits everyone else. The one thing it does poorly is company financials: its financials tab is thin next to StockAnalysis.com's. That is why the two pair rather than compete.
3. Seeking Alpha: ratings and research with a track record
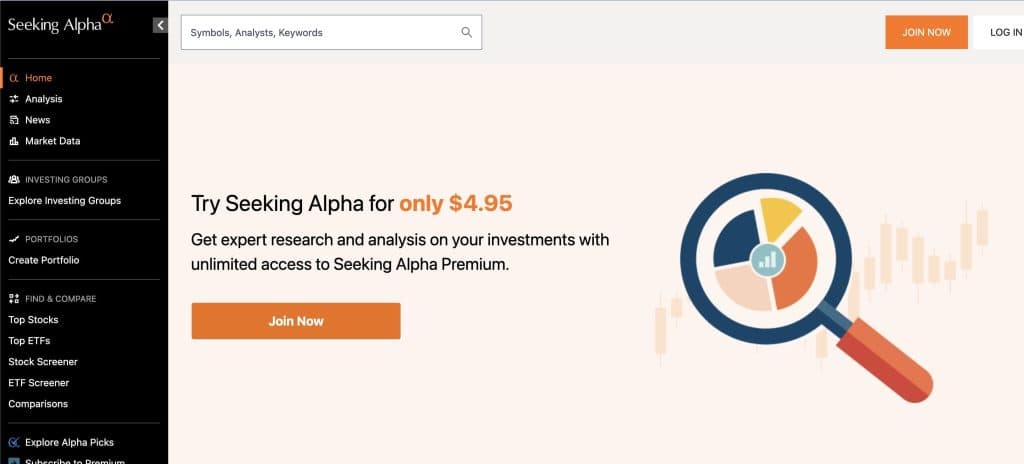
Seeking Alpha is where data meets opinion. Every stock carries three ratings side by side: a quant rating computed from the numbers, the Wall Street analysts' rating and the rating from the site's own writers. Each stock also gets factor grades, which are letter grades on things like value, growth and profitability, and the screeners are built on those grades. It also holds the largest archive of written stock research outside a bank. The feature that earns its place is accountability. Every writer's record sits beside their articles, so you can see whether the person urging a stock on you has been right before.
The free tier shows headlines, a limited number of articles and basic quotes. The ratings, factor grades and the article archive sit behind Premium.
Premium lists at $299 a year, or $269 for the first year through our link, with a 7-day free trial for new subscribers. Alpha Picks, its rules-based picking service, is $499 a year ($449 the first year). The bundle is the cheaper way to hold both. PRO lists at $2,400 a year and is aimed at professionals; our PRO review covers who it is really for. Checked September 2026.
It suits an investor who makes their own decisions and wants the arguments on both sides first. Seeking Alpha Premium review · Alpha Picks review.
4. Ticker Nerd: ours, and a different job
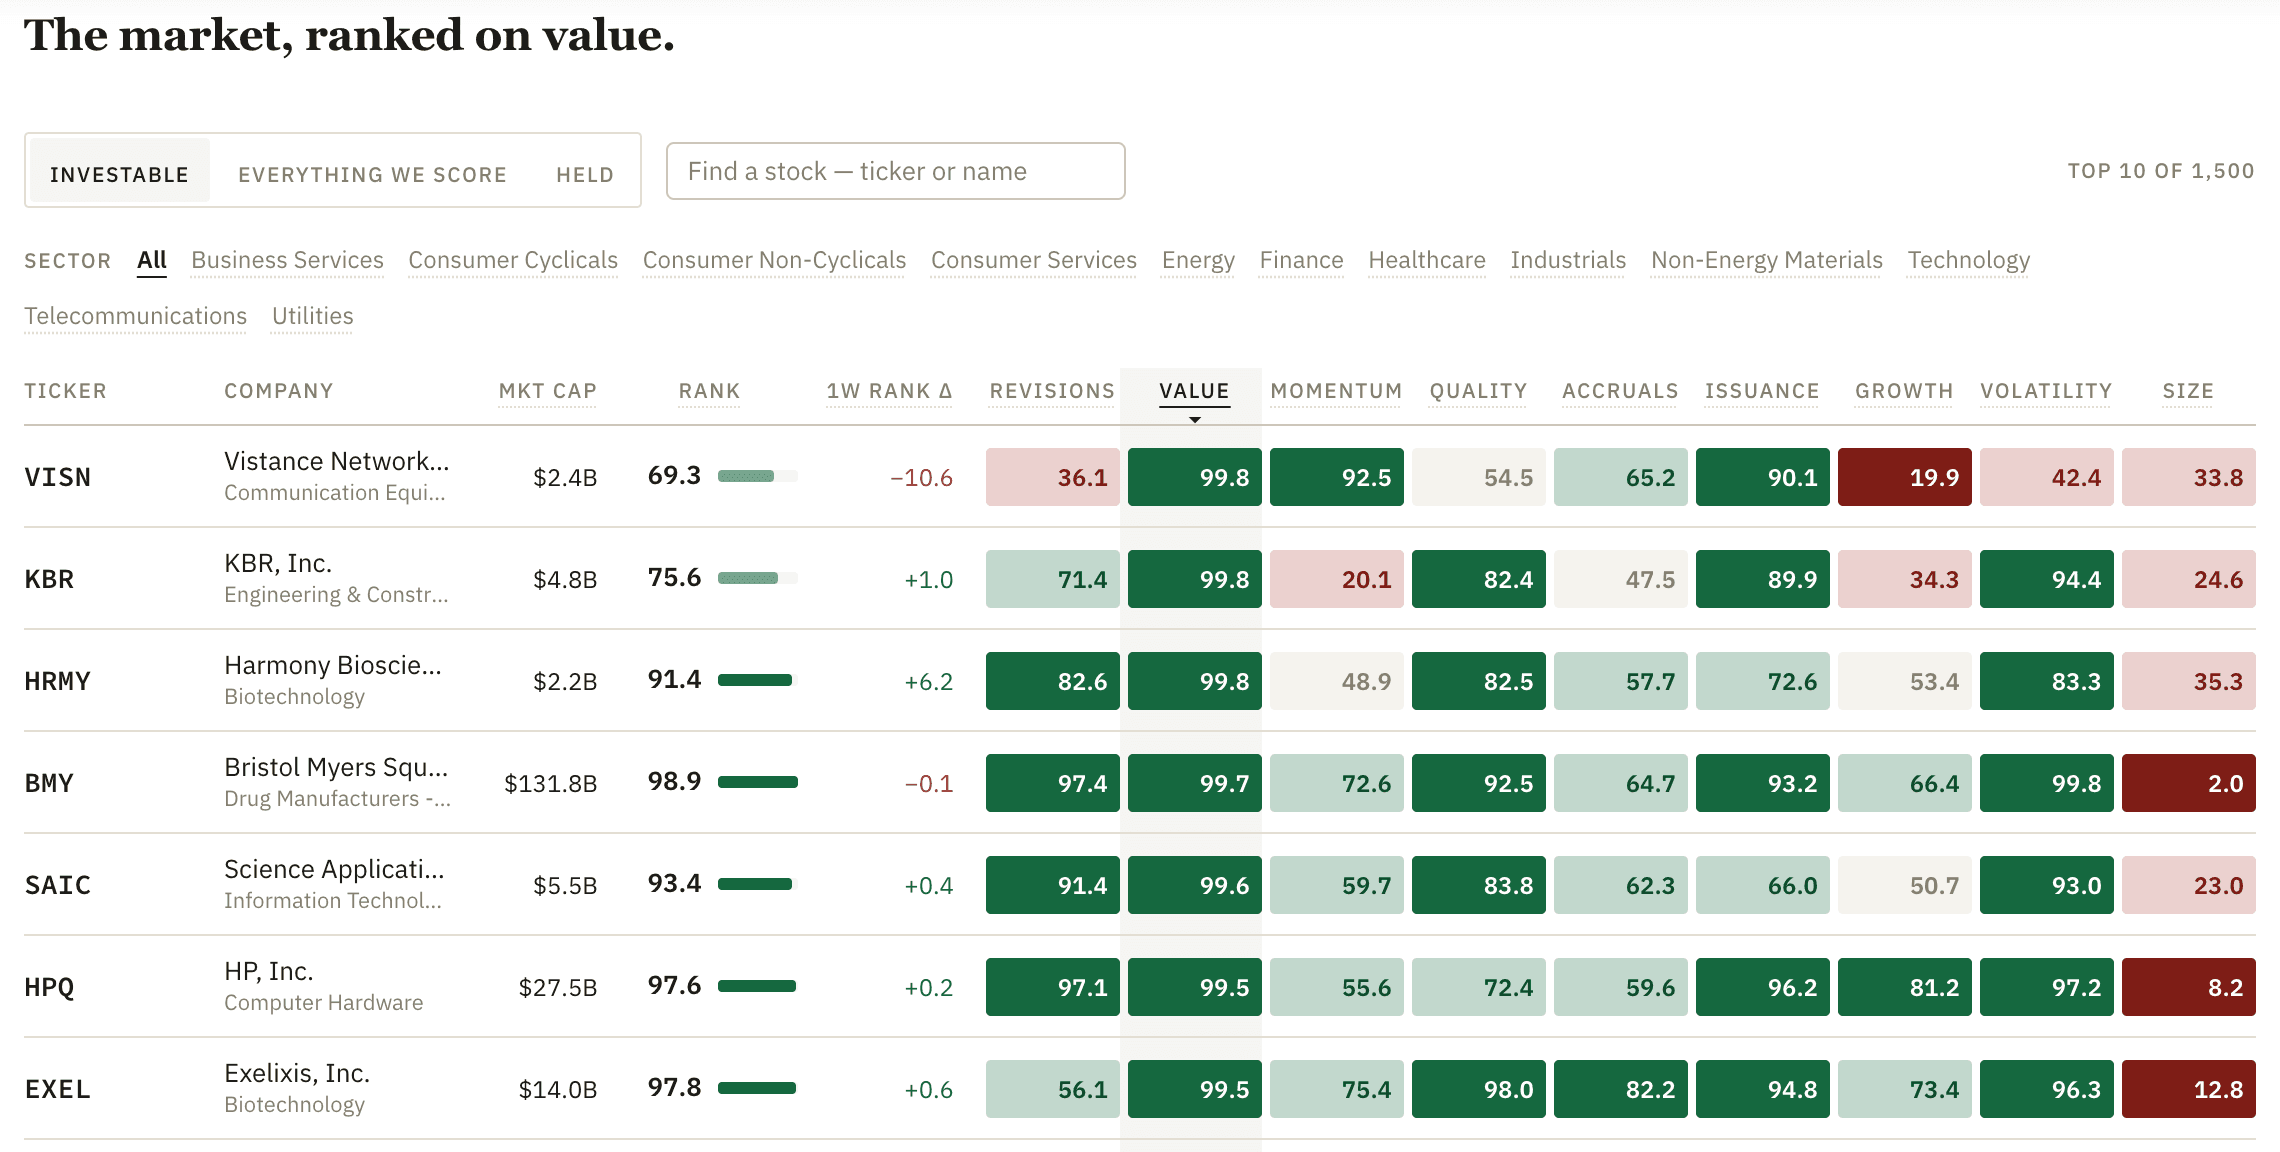
Ticker Nerd is our own product, and it does a different job. It is a portfolio; the tools above are for researching one yourself. The free surfaces are per-stock pages with forecasts, rank and factor scores, screener views over the roughly 1,500 US stocks the model chooses from, and IPO trackers.
Membership is the Ticker Nerd 20: twenty growth stocks picked by published rules from that ranked list. The portfolio is reviewed every four weeks, and each holding has a plain-English brief. The rules decide. The record of every trade, losers included, is on the join page.
Stock pages are free. Membership is $199 a year, checked September 2026 on our own join page.
It suits the part of your money where you want the researching and the deciding done by a system with its record in the open. If you enjoy the research, the eleven other tools here are for you. Ticker Nerd's free stock pages are a decent second opinion on any name you are working on.
5. Stock Rover: the deepest screener sold to individuals
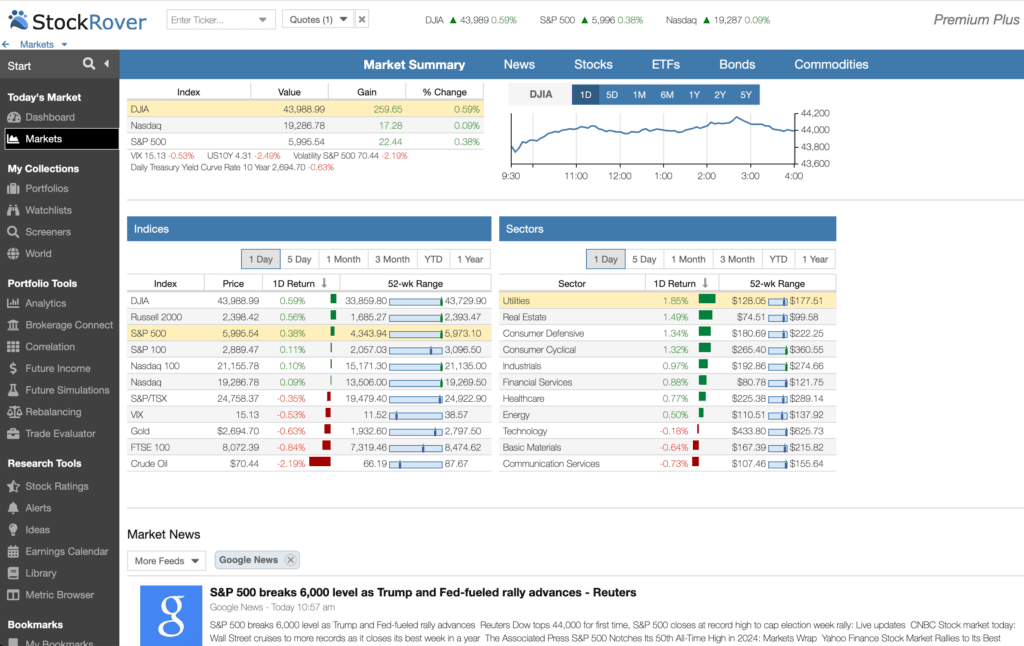
Stock Rover is the closest a private investor gets to a terminal's screening. Its top tiers screen on 800+ metrics. You can screen by your own formula, which Stock Rover calls equation screening. You can rank and weight the results, and see where a stock sits against the whole market as a percentile. A spreadsheet-style table compares stocks side by side. Version 12 (May 2026) added 20 years of financial history, options chains, fund reports on 20,000 mutual funds and a portfolio report. That report shows your returns two ways: money-weighted, which counts the timing of your deposits, and time-weighted, which does not. The interface is dense, and regular users stop noticing within a week.
The free plan keeps a small metric set and watchlists. The serious screening starts at Premium Plus.
Premium is $29 a month billed annually ($348), or $34 month to month. Premium Plus, where equation and ranked screening start, is $49 annual or $70 monthly. Ultimate, with the 20-year history and the new reports, is $79 annual or $99 monthly. Ultimate Pro is $149 annual. Two-year billing takes another 13 to 17% off. The 14-day trial runs on Ultimate with no card. There are no refunds after it, checked September 2026.
It suits a value or dividend investor who screens weekly and wants the whole market in one grid. Our full Stock Rover review covers which tier is worth it.
6. TipRanks: analysts ranked by their record
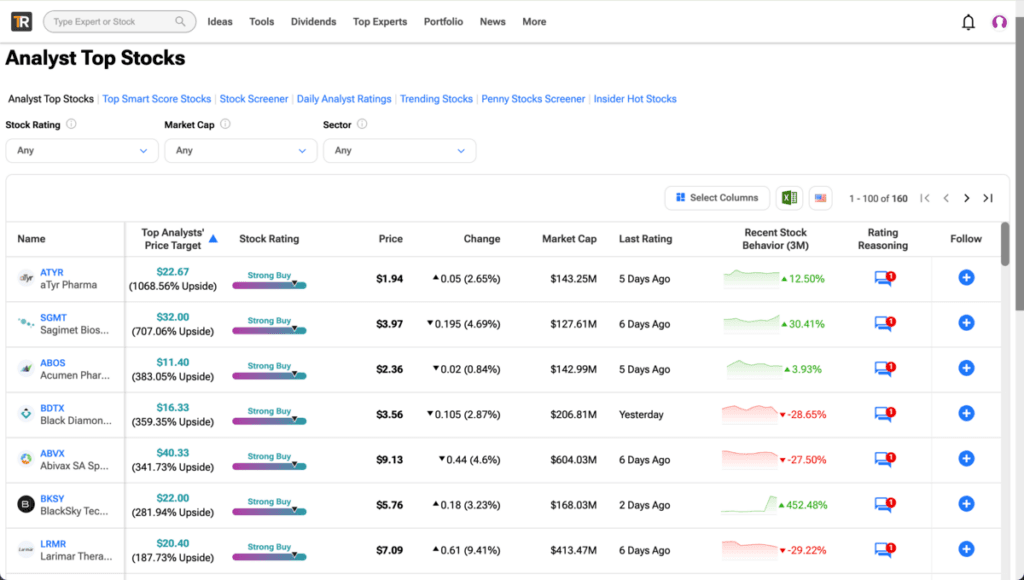
TipRanks does one thing better than anyone: it holds analysts accountable. Every Wall Street analyst is scored on success rate and average return per call, across every rating since 2009. So a price target arrives with the forecaster's actual record attached. It also tracks insider trades and scores news as positive or negative.
The free Basic tier shows each stock's average analyst rating and price target, analyst and insider activity, and a limited view of the Smart Score. Premium adds a filter to top-rated analysts and the full per-stock analysis. Ultimate adds the complete expert rankings and unlimited alerts.
Premium is $359 a year and Ultimate $599, both billed annually only. There is no trial; a 30-day money-back guarantee stands in for one. Prices from TipRanks' site, checked September 2026. The "per month" figures it shows are the annual price divided by twelve.
It suits an investor who reads analyst targets and wants to know which ones to trust. The Smart Score is a marketing feature, and the past-performance test behind it is TipRanks' own. Our full TipRanks review explains where the data helps and where it stops.
7. Simply Wall St: the fastest first impression
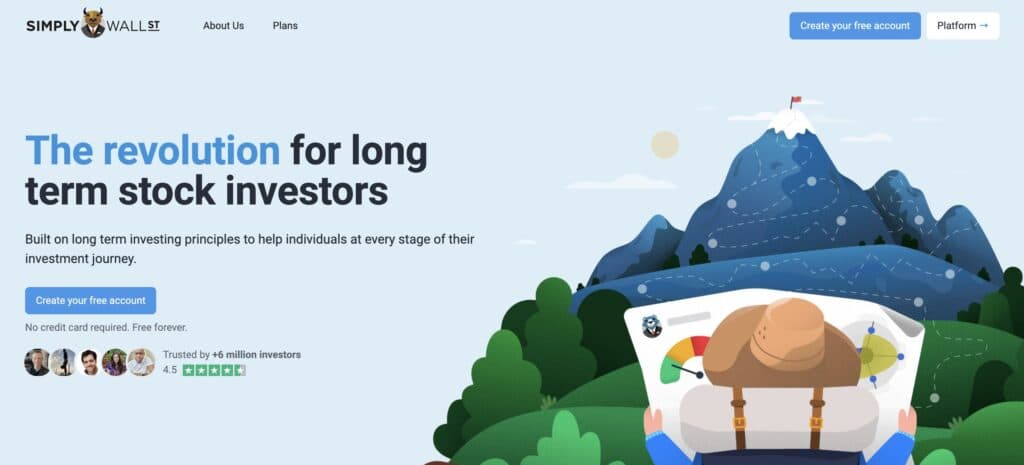
Simply Wall St turns a company's financials into one graphic, the snowflake. It scores value, future growth, past performance, financial health and dividends at a glance. It is the quickest way to get a first read on an unfamiliar company. The picture-based reports help newer investors see how the pieces connect before they can read a balance sheet.
The free plan covers five company reports a month, one portfolio of ten holdings and five watchlists. Premium lifts that to 30 reports and three portfolios. Unlimited removes the caps.
Premium and Unlimited are billed yearly and priced by region. From Australia the plans page showed A$14.95 and A$29.95 a month, checked September 2026, and the US figures differ. Premium starts with a free trial.
It suits a beginner, and anyone who wants a five-second verdict before deciding whether to spend an hour. Experienced investors will want the raw numbers underneath, which is StockAnalysis.com's job.
8. Quiver Quantitative: the data nobody else shows
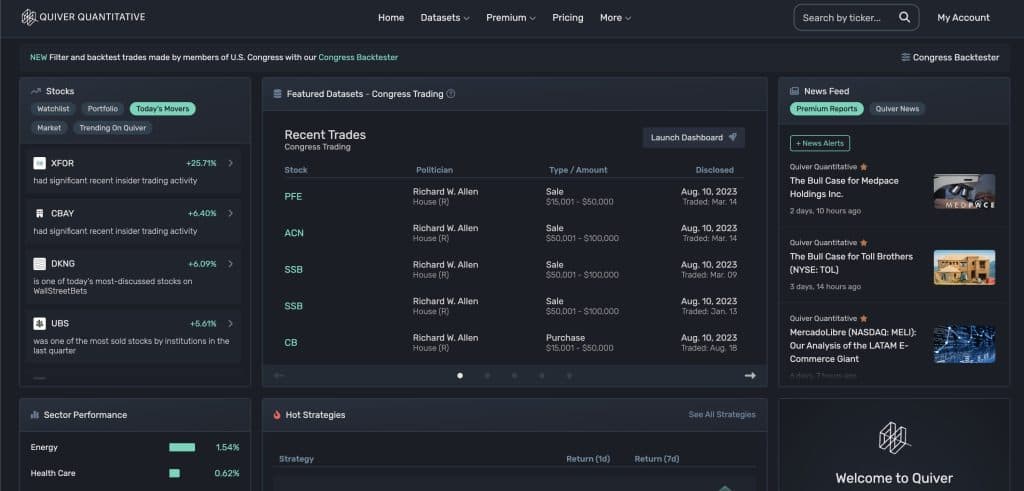
Quiver collects the datasets the mainstream sites skip: trades disclosed by members of Congress, government contracts, lobbying spend, patent filings, corporate flights, and mentions on Reddit and Google Trends. None of it should drive a decision alone, and most of it is noise most of the time. But when an unusual signal shows up here, it is the kind you cannot find on Yahoo.
The free Visitor tier has live data on the main datasets, including congressional trades and government contracts. Premium adds Quiver's own trading strategies, tested on past data, plus alerts and the option to copy those trades through a partner.
Premium is $30 a month, or $25 a month billed yearly ($300). There is a 7-day trial on the monthly plan and a 30-day trial on the annual plan, checked September 2026.
It suits a curious investor who already has the company numbers covered and wants a second, stranger lens. Treat the strategy performance figures as Quiver's own tests on past data, which is what they are.
9. Yahoo Finance: the free staple
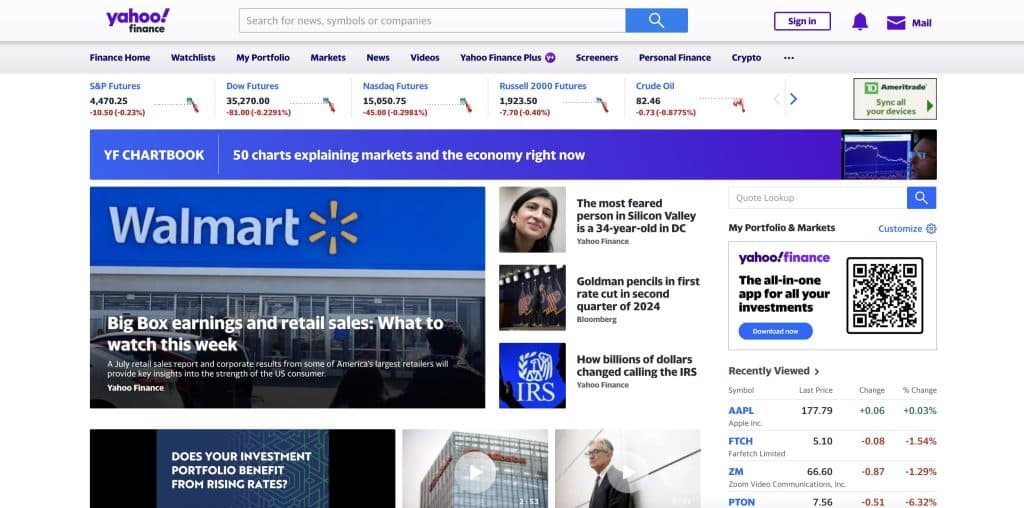
Yahoo Finance is still the default free site. It has quotes, news, past prices, basic financials and a portfolio tracker in one place. Its news feed is the one most people read, whether they mean to or not. Treat the feed as a mix of reporting and opinion. Treat the financial data as good enough, but not the final word.
The free tier is the product worth using. The paid tiers add ad-free pages, Morningstar research reports and fair-value estimates, which are an analyst's view of what a stock is worth. Gold adds a customisable workspace called AlphaSpace.
Bronze is $9.95 a month, or $7.95 billed yearly ($95.40), with a first-year promotion at $6.95. Silver is $24.95 monthly or $19.95 yearly ($239.40). Gold is $49.95 monthly or $39.95 yearly ($479.40). Checked September 2026.
It suits everyone as the free news-and-quotes tab. Nobody on this list needs Silver or Gold. The tools above do each of those jobs better for the same money.
10. Google Finance: the simplest portfolio tracker
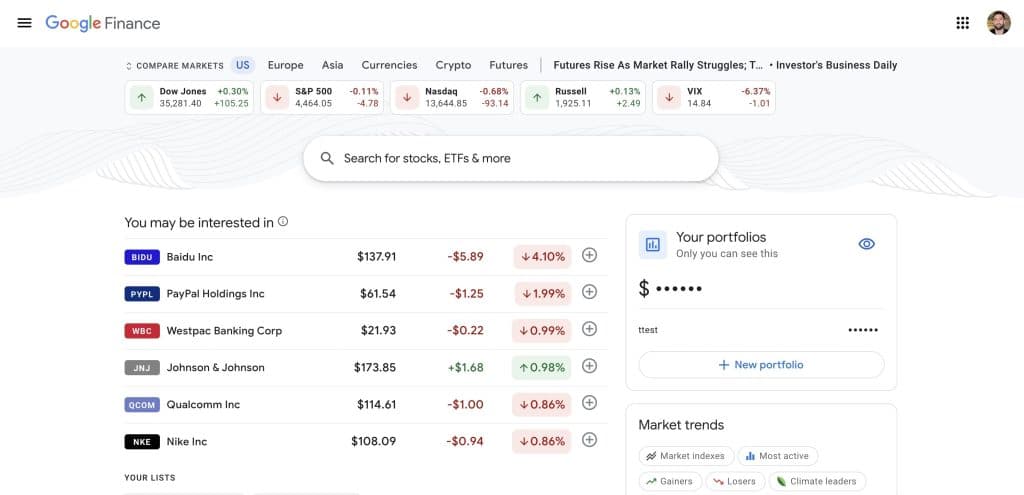
Google Finance is the plainest tool on the list: clean quotes, basic charts, headlines and a free portfolio tracker. The tracker shows your performance and how your money is split across holdings, with no spreadsheet. Type a ticker into Google search and you are already using it.
There is no paid tier. There are also no ratings, no screener and no financial history beyond the basics. That is exactly its use case: a place to see what you own and what it did today.
It is free, and it will stay free.
It suits anyone who wants to watch a handful of stocks without being sold anything. The only account you need is the Google one you already have.
11. Investopedia: the reference beside the tools
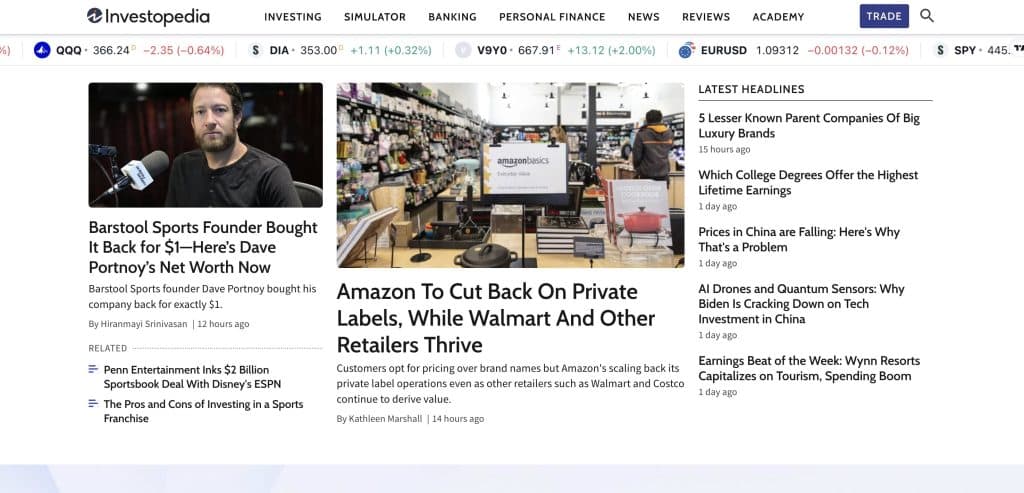
Investopedia is the reference you keep open next to the research tools. It is a dictionary, and a good one. When a screener throws a term at you (EV/EBITDA, accruals, float, short interest), its explainers are the fastest reliable answer. They are edited and reviewed, never crowd-written. The stock simulator is a safe place to run a first portfolio with pretend money.
All of it is free. There is no paid tier for the site itself, only for its courses.
It suits every beginner. It also suits every experienced investor who meets an unfamiliar metric twice a month. One caution: its explainers describe how a ratio is calculated, never whether it predicts anything. Read them for definitions and go to the data for the answer.
12. The Motley Fool: picks with a reason, reviewed separately
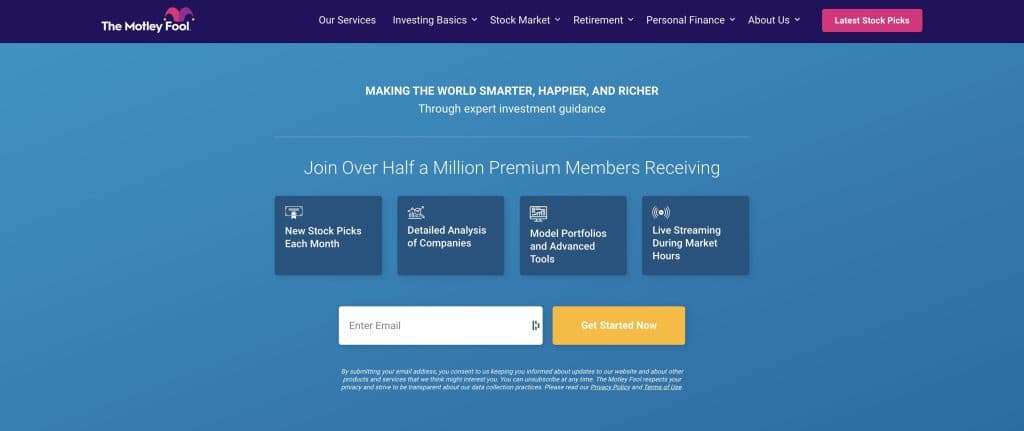
The Motley Fool sits at the edge of this list. Its free site is financial news and commentary, readable and often useful. The real product is stock picking. Stock Advisor sends two analyst picks a month with a written case for each, and it has the longest public record in the business.
The free tier is the news site. As a research platform it is thinner than the tools above. As a picking service it belongs with the best stock advice websites, where the record is examined properly.
Stock Advisor lists at $199 a year. New members pay $99 for the first year, or $199 for three years, through our link, and renew at list price when the term ends. There is no trial. The 30-day membership-fee-back guarantee is the way to test it. Checked September 2026.
It suits an investor who wants named picks with a written reason and will hold each for years. Our hands-on Stock Advisor review covers how the Fool's record is built and who should skip it.
Best stock analysis website: which one?
The answer is StockAnalysis.com, for the reason the take gave. It holds the reported numbers on more companies, over more years, faster and cheaper than any rival. It adds no opinion of its own. The best stock analysis website is the one you check every other site against. That is its job.
If the question is "best stock analysis website for my kind of investing", the answer changes. Stock Rover for screening the whole market, Seeking Alpha for reading the argument, TipRanks for weighing analysts, TradingView for the chart. Each is the best at its one job and ordinary at the others.
Free stock analysis sites that are enough
Four free sites cover what most private investors do. StockAnalysis.com for the statements and the screener, TradingView for the chart, Yahoo Finance for news and a portfolio, Investopedia for the words. Together they cost nothing and replace most of what a paid retail subscription sold five years ago.
The limits arrive in a predictable order. Five years of history runs out the first time you want to see a company through a recession. The free chart's indicator cap runs out the first time you build a set of rules to trade by. A free screener runs out when you want to rank on a formula. Pay for the one you hit, and only that one.
Investment research platforms professionals use
A Bloomberg Terminal, FactSet or Refinitiv Eikon seat costs on the order of $25,000 a year and is licensed to firms rather than individuals. It earns that fee on two things no retail tool offers. One is the live order book, the list of every buy and sell order waiting in every market. The other is the chat network that brokers and fund managers run on. Bloomberg does not publish a list price; that figure is the one the industry works from.
Of the twelve here, Stock Rover's Ultimate tiers get closest for screening and comparison. Seeking Alpha PRO at $2,400 a year is the nearest thing to a broker's research feed. StockAnalysis.com's 40-year statements are the terminal's financials tab for $79 a year. Without a seat, a private investor loses speed and coverage of markets they were never going to trade. That is a smaller loss than the price gap suggests.
How to build a research stack
Use three tools, one per job. The first is a data site, where you check what the company has reported. The second is a charting tool, where you see what the price has done. The third is an opinion source, where you read what other people think and check whether they have been right before. By name: StockAnalysis.com, TradingView and Seeking Alpha.
Two rules keep the stack honest. Every subscription must be one you open weekly, or it goes. And the data site comes before the opinion source on every ticker, so the numbers frame the argument and not the other way round. Stock Rover replaces the data site if you screen heavily. TipRanks replaces the opinion source if you read analyst targets. The chart slot rarely changes.
Verdict
Start free with StockAnalysis.com, TradingView and Yahoo Finance. That gives you most of what a retail research subscription sold five years ago. The first upgrade worth paying for is StockAnalysis Pro at $79 a year. Financial history is the one thing free tiers ration, and it is the thing that shows whether a business is worth owning through a boom and a slump. TradingView Essential and Seeking Alpha Premium are the next two, in whichever order your habits demand.
You may find you would rather not run a research process at all. That is the case Ticker Nerd membership was built for. The portfolio is decided by published rules, with every trade on the record.
Also worth knowing
- SEC EDGAR is the original source every site above repackages. 13F filings, the quarterly reports of what big funds own, land here first.
- WhaleWisdom is the cleanest free view of hedge-fund 13F positions.
- Morningstar has the deepest written research. It sits with the best stock advisor services because that is how people shop for it.
- Finimize is a free daily briefing for beginners.
Quick answers.
Which website is best for stock research?
No single website covers the whole job, so pick one site per task. StockAnalysis.com is the best stock research website for company data. It has financial statements on 130,000+ stocks and funds, a screener and ETF holdings, free without an account. Its Pro plan adds 10 to 40 years of history for $79 a year. TradingView is the best for charts, and Seeking Alpha is the best for ratings and written research. Those three together cost under $500 a year and cover what most private investors need.
What is the best free stock analysis site?
StockAnalysis.com. The free tier gives five years of income statements, balance sheets and cash flows, with no account required. It also has a screener, ETF holdings, IPO calendars and analyst price targets. Its pages load faster than any rival's. Yahoo Finance is the best free site for news, quotes and portfolio tracking. Google Finance is the simplest free portfolio tracker. Prices checked September 2026.
What is the best stock analysis website for beginners?
Simply Wall St for a first look at a company. Its snowflake graphic scores value, growth, past performance, financial health and dividends, with no ratios to decode. The free plan covers five company reports a month. Investopedia for the vocabulary, since every screener throws terms like EV/EBITDA at you. Once those two make sense, move to StockAnalysis.com, where the same facts are shown as numbers.
What investment research platforms do professionals use?
Bloomberg Terminal, FactSet and Refinitiv Eikon. They cost on the order of $25,000 a year a seat and are sold to firms rather than individuals. Of the retail tools, Stock Rover comes closest for screening and comparison. Its top tiers have 800+ metrics, screening by your own formula and 20 years of financial history. Seeking Alpha PRO at $2,400 a year is the closest for written research and analyst-style ratings. No retail tool shows the terminal's live order book or its chat network, and most private investors need neither.
Is StockAnalysis.com reliable?
Yes for the numbers it publishes. It collects company filings and Wall Street analysts' ratings and shows them as reported. It does not change them and makes no calls of its own, and its help centre says so plainly. We cite its IPO calendars on our own IPO pages for that reason. Where it is thin is opinion: there are no ratings, no written research and no community, by design. Treat it as the reference for what a company has reported, and go elsewhere for what anyone thinks about it.
Do you need to pay for stock research?
Not at first. Every tool on this list has a free tier. StockAnalysis.com, Yahoo Finance, Google Finance and Investopedia between them give you statements, quotes, news, portfolio tracking and definitions for nothing. Paying makes sense for three things. The first is financial history longer than five years, which StockAnalysis Pro sells for $79 a year. The second is screening on hundreds of metrics at once, which Stock Rover sells from $29 a month billed annually. The third is written research with a visible track record, which Seeking Alpha Premium sells for $299 a year, $269 the first year. Spend on whichever of those you hit first, and only then.
Which tool is best for stock charts?
TradingView. Its free tier charts stocks, ETFs, forex and crypto. It has more indicators and better drawing tools than most brokers' paid platforms. Pine Script, its own coding language, lets you write your own indicators and test them on past prices. Paid plans start at $12.95 a month billed annually ($14.95 month to month), for more indicators per chart and no ads, with a 30-day trial. Prices checked September 2026.
Which tool is best for stock screening?
Stock Rover for depth and StockAnalysis.com for speed. Stock Rover screens on 800+ metrics, with formula, ranked and percentile screening, from $29 a month billed annually and with a 14-day free trial. StockAnalysis.com's free screener has 317 filters and returns results in a second, which is enough for most first passes. TradingView's screener is the best of the free options for chart-based filters.
The market re-ranks every week. Monday's email says what moved.
Computed off the Friday close and sent before the US open.
Market Radar reports the week’s largest rank changes across roughly 4,600 US stocks, the factor behind each one, and where the market went.