DEDEIndustrials · Farm & Heavy Construction Machinery

DE Stock Forecast: Deere & Co. Price Predictions for 2026-2027

Last close, 3 Aug 2026
$605
+2.09% on the day

The 24 Wall Street analysts covering Deere & Co. hold a median 12-month price target of $640 — +5.8% from the last close. Ticker Nerd's systematic factor model, run across ~4,600 US stocks, ranks it 70 of 100 as at 1 Aug 2026 — in the upper half. Here, the model and the Street point the same way.

Market cap
$161.9B
Ticker Nerd rank
70 / 100
Median analyst target
$640
Analysts covering
24
Total return, dividends reinvested
1W
−3.2%
1M
−2.6%
YTD
+30.7%
1Y
+22.3%
From 52W high
−8.2%
From 52W low
+39.0%
$435
$659
52-week range, adjusted closes · the dot is the last close
Ticker Nerd rank

DE stock analysis: one number for the whole business

Consensus tells you what everyone already believes. The model scores Deere & Co. on its factor families — the same systematic rank behind the Ticker Nerd portfolio.

Where the model ranks itAs at 1 Aug 2026
70 / 100

Percentile across ~4,600 US stocks on Ticker Nerd’s systematic factor model. Higher is better. How the model is built and tested

Issuance
94
Volatility
93
Revisions
71
Momentum
67
Growth
63
Accruals
61
Value
51
Quality
42
Size
2

Issuance (94): The share count has been shrinking and the company is not leaning on new borrowing.

Quality (42): Profits are thin or unreliable for the size of the business, or they are not turning into cash.

Size (2): Larger than most of the companies we track — more scrutinised, less often mispriced.

The rank is the raw material. Whether the rules would actually own Deere & Co. — and when they’d sell — is the membership.

Wall Street

DE stock forecast 2026-2027: analyst price targets & predictions

The bullish and bearish analyst opinions on DE, reported as data — targets and ratings, the market's view beside the model's.

Share price and the analyst range, 12 monthsAdjusted close, US dollars
$400$500$600$700$800Oct 25Jan 26Apr 26Jul 26DEHigh $812Median $640Low $500

Price targets and ratings are third-party analyst estimates, reported here as data. They are not Ticker Nerd forecasts, and they are frequently wrong.

What Wall Street says24 analysts
13 Buy11 Hold0 Sell
Low $500Median $640High $812

The green dot is the last close — the median target sits +5.8% from it.

Recent analyst actionsNewest first
DateFirmActionRatingTarget
17 July 2026DA DavidsonMaintainsBuy$685
14 July 2026CitigroupMaintainsNeutral$575$610
2 July 2026Truist SecuritiesMaintainsBuy$759$812
2 July 2026Truist SecuritiesMaintainsBuy
4 June 2026JP MorganMaintainsNeutral
1 June 2026RBC CapitalReiteratesOutperform
26 May 2026RBC CapitalMaintainsOutperform
22 May 2026B of A SecuritiesMaintainsNeutral
22 May 2026DA DavidsonMaintainsBuy
10 Apr 2026JP MorganMaintainsNeutral
8 Apr 2026JefferiesUpgradeHold
1 Apr 2026BarclaysMaintainsOverweight
9 Mar 2026CitigroupMaintainsNeutral
24 Feb 2026Morgan StanleyMaintainsOverweight
23 Feb 2026CitigroupMaintainsNeutral
23 Feb 2026DA DavidsonMaintainsBuy
23 Feb 2026Evercore ISI GroupMaintainsIn-Line
23 Feb 2026Freedom BrokerMaintainsHold
23 Feb 2026JefferiesDowngradeUnderperform
20 Feb 2026B of A SecuritiesMaintainsNeutral

Price targets and ratings are third-party analyst estimates, reported here as data. They are not Ticker Nerd forecasts, and they are frequently wrong.

Estimates

DE analyst estimate revisions

Not the forecast itself — the direction analysts are revising it. Revision direction is one of the model's factor families.

Which way the estimates are movingNext fiscal year
EPS revision, 90 days
+1.2%
Analysts raising
12
Analysts cutting
5
Fundamentals

Deere & Co. (DE) financial data

A margin means little on its own. Each bar marks where the figure sits across the whole US universe we score.

Valuation
Trailing P/E
34.1×

Cheaper than 24% of US stocks

Price / sales
3.4×

Cheaper than 37% of US stocks

Price / book
5.9×

Cheaper than 18% of US stocks

EV / EBITDA
23.7×

Cheaper than 13% of US stocks

Growth & margins
Revenue growth (YoY)
−11.1%

Higher than 15% of US stocks

Earnings growth (YoY)
−9.8%

Higher than 26% of US stocks

Gross margin
36.9%

Higher than 47% of US stocks

Operating margin
17.5%

Higher than 77% of US stocks

Net margin
10.1%

Higher than 70% of US stocks

Returns & dividend
Return on equity
18.3%

Higher than 80% of US stocks

Return on assets
3.8%

Higher than 70% of US stocks

Dividend yield
1.1%

Higher than 25% of US dividend payers

Bars mark the percentile across the ~4,600 US stocks Ticker Nerd covers, among those reporting the figure.

Peers

DE vs competitors

The nearest names by industry and size, scored by the same model — like for like.

Its peer group, ranked by the same modelFarm & Heavy Construction Machinery
CompanyMarket capTKN rank
DEDeere & Co.$161.9B
70
PCARPACCAR, Inc.$69.8B
71
CATCaterpillar, Inc.$379.1B
63
CNHCNH Industrial NV$12.7B
58
OSKOshkosh Corp.$9.0B
73
ETNEaton Corp. Plc*$161.1B
75
BAThe Boeing Co.*$164.3B
42

* Nearest Industrials names by size — few farm & heavy construction machinery companies of this scale trade in the US universe.

Market Radar

This page is one stock. Monday covers all of them.

Computed off the Friday close and sent before the US open.

Market Radar reports the week’s largest rank changes across roughly 4,600 US stocks, the factor behind each one, and where the market went. DE appears on the weeks it earns a place.

Free, every Monday. Unsubscribe any time.

News

Latest DE news & analysis

Deere Stock: Buy, Hold, or Sell?

The Motley Fool · 1 Aug 2026neutral

The Motley Fool published an analysis titled "Deere Stock: Buy, Hold, or Sell?" noting that Deere stock has performed well in recent quarters.

Why it matters — This analysis provides a high-level assessment of Deere's recent stock performance, which is relevant to investors monitoring the company's market trajectory.

ALG or DE: Which Is the Better Value Stock Right Now?

Zacks Investment Research · 31 July 2026neutral

Zacks Investment Research published a comparison between Alamo Group (ALG) and Deere & Co. (DE), examining which of the two manufacturing-farm-equipment stocks might be the better option for value-oriented investors.

Why it matters — The article directly compares Deere to a peer in its sector, which could influence how investors assess Deere's relative valuation.

Here is What to Know Beyond Why Deere & Company (DE) is a Trending Stock

Zacks Investment Research · 28 July 2026neutral

Zacks.com reports that Deere (DE) has been a trending stock among its users recently, prompting a review of the facts that could shape the stock's prospects.

Why it matters — The article signals heightened investor attention on Deere, which DE watchers would note as an indicator of shifting market sentiment around the company.

These 2 Industrial Products Stocks Could Beat Earnings: Why They Should Be on Your Radar

Zacks Investment Research · 28 July 2026neutral

Zacks Investment Research published an article on using its Earnings ESP tool to identify industrial products stocks that may beat quarterly earnings estimates.

Why it matters — Deere watchers would care because the article discusses a methodology for spotting potential earnings beats in the industrial products sector, which includes Deere.

FAQ

Frequently asked questions about DE stock

What is the DE stock price forecast for 2026-2027?

The 24 Wall Street analysts covering Deere & Co. have a median 12-month price target of $640, with estimates ranging from $500 to $812. These are third-party analyst estimates, not Ticker Nerd forecasts, and they are frequently wrong.

Is DE stock a buy right now?

Of the 24 analysts covering Deere & Co., 13 rate it a Buy, 11 a Hold and 0 a Sell. Ticker Nerd's systematic factor model ranks Deere & Co. 70 out of 100 across roughly 4,600 US stocks as at 1 Aug 2026. None of this is personal advice — it does not consider your circumstances.

How does Ticker Nerd's model rank DE?

As at 1 Aug 2026, Deere & Co. ranks 70 out of 100 on Ticker Nerd's systematic factor model — a percentile across roughly 4,600 US stocks, built from its factor families. Its strongest factor family is Issuance (94 of 100).

Will DE stock go up?

No one can know that. What the data says: the median 12-month target from 24 analysts implies +5.8% from the last close, and Ticker Nerd's factor model ranks Deere & Co. 70 out of 100 as at 1 Aug 2026. Analyst targets are third-party estimates and frequently wrong; none of this is personal advice.

What is the DE stock forecast for 2030?

No analyst covering Deere & Co. publishes a 2030 price target — Wall Street targets run 12 to 18 months out. Sites quoting a 2030 price for DE are extrapolating price history, which says nothing about the business. The furthest attributed numbers are the current analyst targets: $500 to $812 over the next 12 months.

How has DE stock performed over the past year?

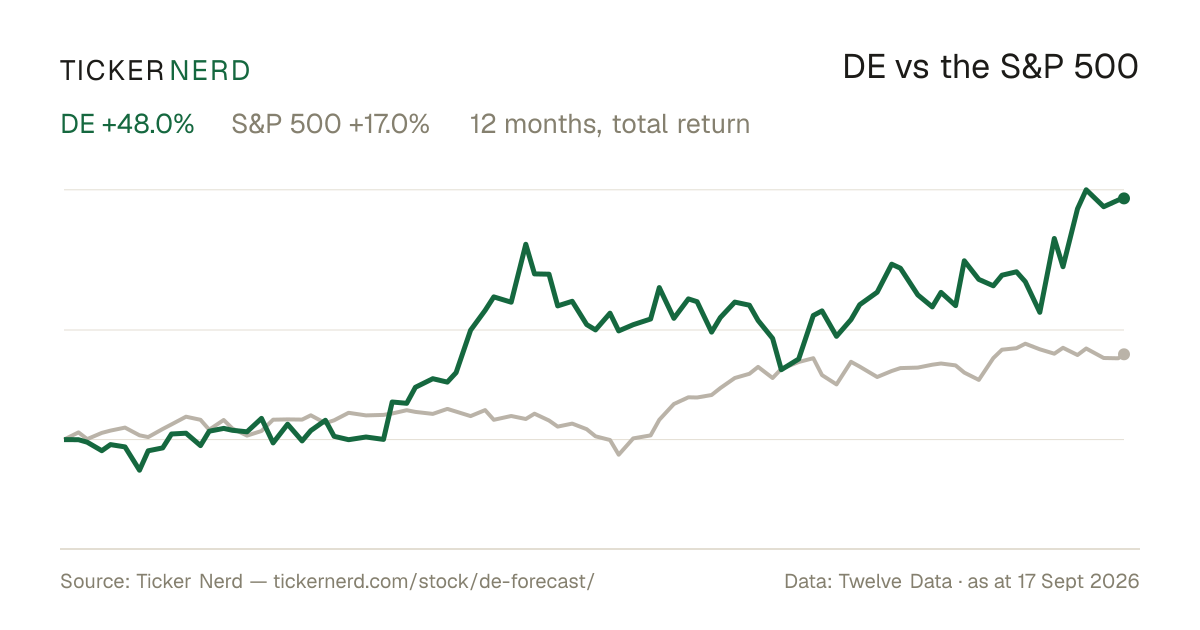
Deere & Co. returned +22.3% over the 12 months to 3 Aug 2026, with dividends reinvested. Past performance does not indicate future returns.

What does Deere & Co. do?

Deere & Company is a global manufacturer of agricultural, construction, and forestry equipment, best known for its John Deere-branded machinery. Headquartered in Moline, Illinois, the company focuses on providing equipment and technology solutions that support food production, infrastructure development, and land management worldwide.

What is the latest news on DE?

The most recent item we track (The Motley Fool, 1 Aug 2026): "Deere Stock: Buy, Hold, or Sell?". The Motley Fool published an analysis titled "Deere Stock: Buy, Hold, or Sell?" noting that Deere stock has performed well in recent quarters.

Company

About Deere & Co.

Deere & Company is a global manufacturer of agricultural, construction, and forestry equipment, best known for its John Deere-branded machinery. Headquartered in Moline, Illinois, the company focuses on providing equipment and technology solutions that support food production, infrastructure development, and land management worldwide. Deere & Company operates through key segments including Production and Precision Agriculture, Small Agriculture and Turf, Construction and Forestry, and Financial Services, offering tractors, combines, sprayers, loaders, excavators, and turf care equipment, as well as integrated precision agriculture technologies and data-driven tools to optimize operations. Its Financial Services arm provides financing and leasing solutions that support equipment purchases and dealer inventory, facilitating access to its products across diverse markets. Today, Deere & Company plays a central role in the broader capital goods and industrials space, serving farmers, contractors, governments, and commercial clients seeking durable equipment and integrated technology for mission-critical operations.

CEO Mr. John C. May II · 73,100 employees · United States · https://www.deere.com