FOAFOAFinancial Services · Credit Services

FOA Stock Forecast: Finance of America Cos., Inc. Price Predictions for 2026-2027

Last close, 14 Aug 2026
$22
−2.47% on the day

The 3 Wall Street analysts covering Finance of America Cos., Inc. hold a median 12-month price target of $31 — +42.5% from the last close. Ticker Nerd's systematic factor model, run across ~4,600 US stocks, ranks it 24 of 100 as at 15 Aug 2026 — in the weakest quartile. The Street sees upside; the factor read is a caution. That gap is the story on this page.

Market cap
$200.6M
Ticker Nerd rank
24 / 100
Median analyst target
$31
Analysts covering
3
Total return, dividends reinvested
1W
−1.6%
1M
−17.4%
YTD
−10.1%
1Y
−22.1%
From 52W high
−24.2%
From 52W low
+35.6%
$16
$29
52-week range, adjusted closes · the dot is the last close
Ticker Nerd rank

FOA stock analysis: one number for the whole business

Consensus tells you what everyone already believes. The model scores Finance of America Cos., Inc. on its factor families — the same systematic rank behind the Ticker Nerd portfolio.

Where the model ranks itAs at 15 Aug 2026
24 / 100

Percentile across ~4,600 US stocks on Ticker Nerd’s systematic factor model. Higher is better. How the model is built and tested

Value
58
Issuance
54
Size
53
Momentum
47
Revisions
41
Quality
40
Volatility
33
Growth
20
Accruals
14

Value (58): The shares cost little relative to the profits and assets behind them — which can mean the market is too gloomy, or that the business really is in trouble.

Accruals (14): A large share of reported profit has not shown up as cash, or the balance sheet is expanding quickly — both tend to unwind.

Built and run by Aslam Ghouse, an ex-Goldman Sachs quant trader with fourteen years in markets.

Wall Street

FOA stock forecast 2026-2027: analyst price targets & predictions

The bullish and bearish analyst opinions on FOA, reported as data — targets and ratings, the market's view beside the model's.

Share price and the analyst range, 12 monthsAdjusted close, US dollars
$15$20$25$30Oct 25Jan 26Apr 26Jul 26FOAHigh $32Median $31Low $30

Price targets and ratings are third-party analyst estimates, reported here as data. They are not Ticker Nerd forecasts, and they are frequently wrong.

What Wall Street says3 analysts
2 Buy1 Hold0 Sell
Low $30Median $31High $32

The green dot is the last close — the median target sits +42.5% from it.

Recent analyst actionsNewest first
DateFirmActionRatingTarget
5 Aug 2026B. Riley SecuritiesReiteratesBuy$25$32
2 Apr 2026B. Riley SecuritiesInitiatesBuy$23
2 Apr 2026B. Riley SecuritiesInitiatesBuy
26 Nov 2025UBSMaintainsNeutral
15 July 2025UBSMaintainsNeutral
16 Apr 2025UBSMaintainsNeutral
25 Mar 2025Raymond JamesMaintainsOutperform
20 Nov 2024UBSDowngradeNeutral
5 Sept 2024UBSMaintainsBuy
6 Dec 2023UBSInitiatesBuy
17 Nov 2023Raymond JamesMaintainsOutperform
30 Aug 2023Raymond JamesMaintainsOutperform
16 Dec 2022Morgan StanleyMaintainsEqual-Weight
21 Nov 2022Credit SuisseMaintainsOutperform
11 Nov 2022Raymond JamesDowngradeOutperform
4 Oct 2022Goldman SachsMaintainsNeutral
15 Aug 2022Morgan StanleyMaintainsEqual-Weight
8 Aug 2022Raymond JamesMaintainsStrong Buy
12 May 2022Goldman SachsMaintainsNeutral
11 May 2022Raymond JamesMaintainsStrong Buy

Price targets and ratings are third-party analyst estimates, reported here as data. They are not Ticker Nerd forecasts, and they are frequently wrong.

Market Radar

This page is one stock. Monday covers all of them.

Computed off the Friday close and sent before the US open.

Market Radar reports the week’s largest rank changes across roughly 4,600 US stocks, the factor behind each one, and where the market went. FOA appears on the weeks it earns a place.

Free, every Monday. Unsubscribe any time.

Estimates

FOA analyst estimate revisions

Not the forecast itself — the direction analysts are revising it. Revision direction is one of the model's factor families.

Which way the estimates are movingNext fiscal year
EPS revision, 90 days
−3.3%
Analysts raising
0
Analysts cutting
1
Fundamentals

Finance of America Cos., Inc. (FOA) financial data

A margin means little on its own. Each bar marks where the figure sits across the whole US universe we score.

Valuation
Trailing P/E
9.7×

Cheaper than 60% of US stocks

Price / sales
0.6×

Cheaper than 80% of US stocks

Price / book
0.6×

Cheaper than 84% of US stocks

EV / EBITDA
Growth & margins
Revenue growth (YoY)
−64.8%

Higher than 4% of US stocks

Earnings growth (YoY)
−94.1%

Higher than 3% of US stocks

Gross margin
Operating margin
−67.6%

Higher than 15% of US stocks

Net margin
−0.1%

Higher than 30% of US stocks

Returns & dividend
Return on equity
−9.9%

Higher than 36% of US stocks

Return on assets
−0.1%

Higher than 43% of US stocks

Dividend yield

Bars mark the percentile across the ~4,600 US stocks Ticker Nerd covers, among those reporting the figure.

Peers

FOA vs competitors

The nearest names by industry and size, scored by the same model — like for like.

Its peer group, ranked by the same modelCredit Services
CompanyMarket capTKN rank
FOAFinance of America Cos., Inc.$200.6M
24
OPFIOppFi, Inc.$611.4M
72
GDOTGreen Dot Corp.$751.6M
55
PRAAPRA Group, Inc.$792.1M
84
LPROOpen Lending Corp.$371.1M
OPRTOportun Financial Corp.$352.6M
77
NAVINavient Corp.$872.0M
68

Look up any of the roughly 4,600 stocks we score.

The rank is the raw material. Whether the rules would actually own Finance of America Cos., Inc. — and when they’d sell — is the membership. See the Ticker Nerd 20 →

News

Latest FOA news & analysis

Finance of America Companies Q2 Earnings Call Highlights

MarketBeat · 5 Aug 2026positive

Finance of America Companies reported second-quarter adjusted net income of $19 million, or $0.84 per share, supported by higher reverse-mortgage production and cash generation, while posting a GAAP net loss tied largely to fair-value adjustments. The company cited these results in maintaining its full-year outlook.

Why it matters — For FOA watchers, the quarter shows profitable adjusted results from stronger reverse-mortgage activity even as fair-value accounting produced a GAAP loss, with management standing by its full-year outlook.

Finance of America Companies Inc. (FOA) Q2 2026 Earnings Call Transcript

Seeking Alpha · 5 Aug 2026neutral

A transcript of Finance of America Companies Inc.'s Q2 2026 earnings call was published on Seeking Alpha. The excerpt only identifies the document's existence and source; it contains no details of the company's performance or guidance.

Why it matters — FOA watchers would care because the earnings-call transcript is a source for management's commentary on quarterly results, though this item itself provides no specifics.

Finance of America Companies Inc. (FOA) Q2 Earnings and Revenues Miss Estimates

Zacks Investment Research · 5 Aug 2026negative

Finance of America Companies Inc. reported Q2 earnings of $0.84 per share, missing the Zacks Consensus Estimate of $1.09 per share. The result compares to earnings of $0.55 per share a year ago, and revenues also missed estimates.

Why it matters — The second-quarter earnings and revenue results came in below analysts' expectations, giving FOA watchers a key read on recent company performance.

Finance of America Reports Second Quarter 2026 Results

Business Wire · 4 Aug 2026positive

Finance of America Companies Inc. reported financial results for the quarter ended June 30, 2026. Funded volume reached $730 million, a 21% increase year over year, and the company reported $0.10 in basic earnings per share, or $1 million of net income attributable to holders.

Why it matters — The report provides a fresh look at the company's quarterly performance, including higher funded volume and a return to positive earnings, which FOA watchers follow closely.

Implied Volatility Surging for Finance of America Stock Options

Zacks Investment Research · 28 July 2026neutral

The article reports that implied volatility is surging for Finance of America (FOA) stock options, and advises investors to monitor the stock closely based on recent options market movements.

Why it matters — A FOA watcher would care because surging implied volatility in options often signals that traders anticipate significant price movement in the stock.

FAQ

Frequently asked questions about FOA stock

What is the FOA stock price forecast for 2026-2027?

The 3 Wall Street analysts covering Finance of America Cos., Inc. have a median 12-month price target of $31, with estimates ranging from $30 to $32. These are third-party analyst estimates, not Ticker Nerd forecasts, and they are frequently wrong.

Is FOA stock a buy right now?

Of the 3 analysts covering Finance of America Cos., Inc., 2 rate it a Buy, 1 a Hold and 0 a Sell. Ticker Nerd's systematic factor model ranks Finance of America Cos., Inc. 24 out of 100 across roughly 4,600 US stocks as at 15 Aug 2026. None of this is personal advice — it does not consider your circumstances.

How does Ticker Nerd's model rank FOA?

As at 15 Aug 2026, Finance of America Cos., Inc. ranks 24 out of 100 on Ticker Nerd's systematic factor model — a percentile across roughly 4,600 US stocks, built from its factor families. Its strongest factor family is Value (58 of 100).

Will FOA stock go up?

No one can know that. What the data says: the median 12-month target from 3 analysts implies +42.5% from the last close, and Ticker Nerd's factor model ranks Finance of America Cos., Inc. 24 out of 100 as at 15 Aug 2026. Analyst targets are third-party estimates and frequently wrong; none of this is personal advice.

What is the FOA stock forecast for 2030?

No analyst covering Finance of America Cos., Inc. publishes a 2030 price target — Wall Street targets run 12 to 18 months out. Sites quoting a 2030 price for FOA are extrapolating price history, which says nothing about the business. The furthest attributed numbers are the current analyst targets: $30 to $32 over the next 12 months.

How has FOA stock performed over the past year?

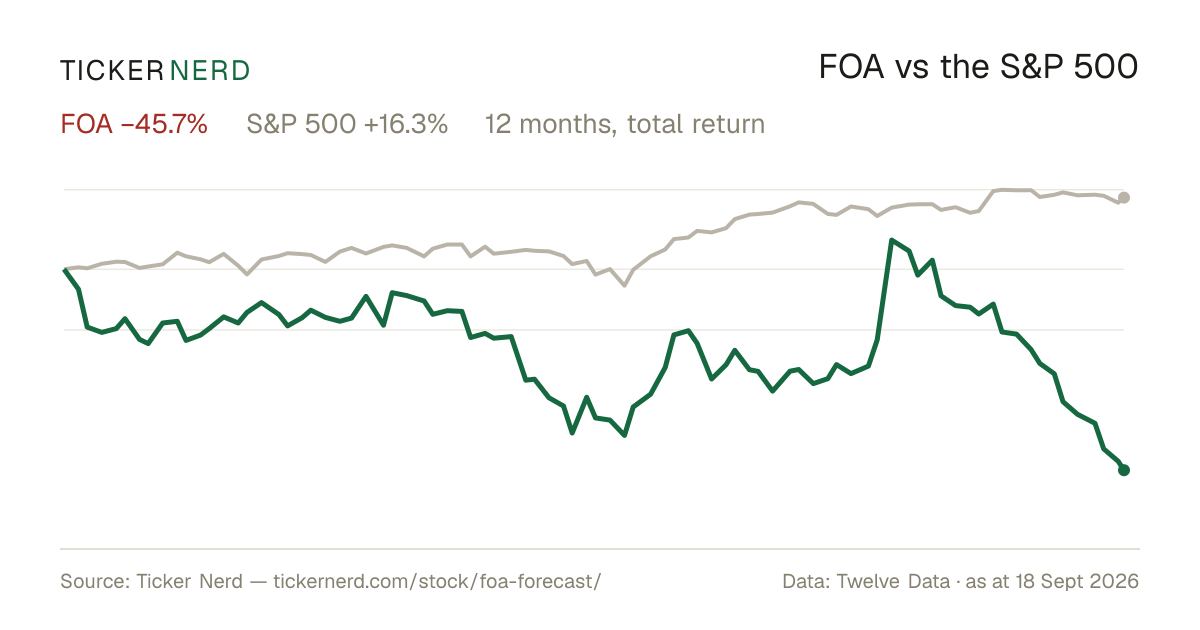
Finance of America Cos., Inc. returned -22.1% over the 12 months to 14 Aug 2026, with dividends reinvested. Past performance does not indicate future returns.

What does Finance of America Cos., Inc. do?

Finance of America Companies Inc. is a diversified, consumer-focused lending platform that operates across a broad spectrum of financial services.

What is the latest news on FOA?

The most recent item we track (MarketBeat, 5 Aug 2026): "Finance of America Companies Q2 Earnings Call Highlights". Finance of America Companies reported second-quarter adjusted net income of $19 million, or $0.84 per share, supported by higher reverse-mortgage production and cash generation, while posting a GAAP net loss tied largely to fair-value adjustments. The company cited these results in maintaining its full-year outlook.

Company

About Finance of America Cos., Inc.

Finance of America Companies Inc. is a diversified, consumer-focused lending platform that operates across a broad spectrum of financial services. The company primarily functions to provide a wide range of financial solutions, including mortgages, commercial real estate loans, consumer lending, and reverse mortgages. It caters to different segments of the financial market, offering tailored services to meet the varied needs of its clients. By utilizing technology and an expansive distribution network, Finance of America Companies Inc. integrates lending solutions with a customer-centric approach. Its operations significantly impact the housing market and retirement planning sectors, particularly through its innovative offerings in reverse mortgage products, which aim to support older homeowners in accessing home equity. With its comprehensive suite of financial products, Finance of America Companies Inc. plays a pivotal role in facilitating home ownership and property investment across the United States, addressing market demands through a strategic and responsive business model.

CEO Mr. Graham A. Fleming · 782 employees · United States · https://www.financeofamerica.com