AMZNAMZNConsumer Cyclical · Internet Retail

AMZN Stock Forecast: Amazon.com, Inc. Price Predictions for 2026-2027

Last close, 21 Aug 2026
$259
−0.56% on the day

The 60 Wall Street analysts covering Amazon.com, Inc. hold a median 12-month price target of $325 — +25.7% from the last close. Ticker Nerd's systematic factor model, run across ~4,600 US stocks, ranks it 49 of 100 as at 22 Aug 2026 — in the lower half.

Market cap
$2.8T
Ticker Nerd rank
49 / 100
Median analyst target
$325
Analysts covering
60
Total return, dividends reinvested
1W
−1.5%
1M
+4.5%
YTD
+12.1%
1Y
+16.5%
From 52W high
−8.9%
From 52W low
+30.1%
$199
$284
52-week range, adjusted closes · the dot is the last close
Ticker Nerd rank

AMZN stock analysis: one number for the whole business

Consensus tells you what everyone already believes. The model scores Amazon.com, Inc. on its factor families — the same systematic rank behind the Ticker Nerd portfolio.

Where the model ranks itAs at 22 Aug 2026
49 / 100

Percentile across ~4,600 US stocks on Ticker Nerd’s systematic factor model. Higher is better. How the model is built and tested

Revisions
93
Quality
82
Growth
81
Momentum
61
Volatility
41
Value
31
Issuance
25
Accruals
22
Size
0

Revisions (93): Analysts have, on balance, been raising their forecasts.

Accruals (22): A large share of reported profit has not shown up as cash, or the balance sheet is expanding quickly — both tend to unwind.

Size (0): Larger than most of the companies we track — more scrutinised, less often mispriced.

Built and run by Aslam Ghouse, an ex-Goldman Sachs quant trader with fourteen years in markets.

The Ticker Nerd Read

Analysts raise forecasts while our model ranks AMZN mid-pack.

As of August 22, 2026, our factor model ranks Amazon.com 48.7 of 100 against the roughly 4,600 US stocks we track, close to the middle of the field. The score is carried by Estimate Revisions (92.7), Quality (82.3) and Growth (81.4), all strong readings. Value (30.8), Investment/Accruals (22.1) and Debt/Equity Issuance (25.5) drag it, and a Market-Cap factor near zero — the stock is among the largest we track — pulls the overall number down.

The Street sits well above the shares. As of August 21, 2026, Amazon closed at $258.65, while the 60 analysts covering it carried a $325 median price target, and 58 of 60 rated it buy or strong buy. That consensus is other people's forecast, and our mid-pack rank does not share its conviction.

The reading turns on the direction of analyst forecasts: the current-year consensus EPS estimate rose 44.3% over 90 days to $12.42 as of August 20, 2026, with 45 analysts raising in the past month against one cut. The weakest drivers — Investment/Accruals (22.1) and Debt/Equity Issuance (25.5) — track how much profit has arrived as cash and how the balance sheet is growing. A shift in capital spending or forecast flow would change the picture.

As of 23 Aug 2026
Wall Street

AMZN stock forecast 2026-2027: analyst price targets & predictions

The bullish and bearish analyst opinions on AMZN, reported as data — targets and ratings, the market's view beside the model's.

Share price and the analyst range, 12 monthsAdjusted close, US dollars
$200$250$300$350$400Oct 25Jan 26Apr 26Jul 26AMZNHigh $405Median $325Low $230

Price targets and ratings are third-party analyst estimates, reported here as data. They are not Ticker Nerd forecasts, and they are frequently wrong.

What Wall Street says60 analysts
58 Buy2 Hold0 Sell
Low $230Median $325High $405

The green dot is the last close — the median target sits +25.7% from it.

Recent analyst actionsNewest first

Of the 20 most recent actions, 7 moved their price target up and 1 moved it down.

DateFirmActionRatingTarget
20 Aug 2026RosenblattAssumesBuy$335
31 July 2026BarclaysMaintainsOverweight
31 July 2026BarclaysMaintainsOverweight$330$365
31 July 2026BenchmarkMaintainsBuy
31 July 2026BenchmarkMaintainsBuy$370$400
31 July 2026BernsteinMaintainsOutperform$315$320
31 July 2026BernsteinMaintainsOutperform
31 July 2026Cantor FitzgeraldMaintainsOverweight
31 July 2026Cantor FitzgeraldMaintainsOverweight$330$320
31 July 2026CitigroupMaintainsBuy$325$350
31 July 2026CitigroupMaintainsBuy
31 July 2026CitizensReiteratesMarket Outperform$315
31 July 2026CitizensReiteratesMarket Outperform
31 July 2026DA DavidsonMaintainsNeutral
31 July 2026DA DavidsonMaintainsNeutral$250
31 July 2026JP MorganMaintainsOverweight
31 July 2026JP MorganMaintainsOverweight$330$365
31 July 2026KeybancMaintainsOverweight$335$350
31 July 2026KeybancMaintainsOverweight
31 July 2026MizuhoMaintainsOutperform$320$330

Price targets and ratings are third-party analyst estimates, reported here as data. They are not Ticker Nerd forecasts, and they are frequently wrong.

Market Radar

This page is one stock. Monday covers all of them.

Computed off the Friday close and sent before the US open.

Market Radar reports the week’s largest rank changes across roughly 4,600 US stocks, the factor behind each one, and where the market went. AMZN appears on the weeks it earns a place.

Free, every Monday. Unsubscribe any time.

Estimates

AMZN analyst estimate revisions

Not the forecast itself — the direction analysts are revising it. Revision direction is one of the model's factor families.

Which way the estimates are movingNext fiscal year
EPS revision, 90 days
+44.3%
Analysts raising
45
Analysts cutting
1
Fundamentals

Amazon.com, Inc. (AMZN) financial data

A margin means little on its own. Each bar marks where the figure sits across the whole US universe we score.

Valuation
Trailing P/E
20.8×

Cheaper than 37% of US stocks

Price / sales
3.6×

Cheaper than 36% of US stocks

Price / book
5.1×

Cheaper than 22% of US stocks

EV / EBITDA
17.3×

Cheaper than 19% of US stocks

Growth & margins
Revenue growth (YoY)
19.6%

Higher than 69% of US stocks

Earnings growth (YoY)
244.9%

Higher than 92% of US stocks

Gross margin
51.8%

Higher than 65% of US stocks

Operating margin
13.7%

Higher than 70% of US stocks

Net margin
17.4%

Higher than 80% of US stocks

Returns & dividend
Return on equity
30.6%

Higher than 88% of US stocks

Return on assets
6.6%

Higher than 83% of US stocks

Dividend yield

Bars mark the percentile across the ~4,600 US stocks Ticker Nerd covers, among those reporting the figure.

Peers

AMZN vs competitors

The nearest names by industry and size, scored by the same model — like for like.

Its peer group, ranked by the same modelInternet Retail
CompanyMarket capTKN rank
AMZNAmazon.com, Inc.$2.8T
49
DASHDoorDash, Inc.$97.1B
43
TSLATesla, Inc.*$1.4T
28
EBAYeBay, Inc.$46.7B
91
CPNGCoupang, Inc.$30.1B
10
HDThe Home Depot, Inc.*$334.1B
41
WWayfair, Inc.$13.5B
83

* Nearest Consumer Cyclical names by size — few internet retail companies of this scale trade in the US universe.

Look up any of the roughly 4,600 stocks we score.

The rank is the raw material. Whether the rules would actually own Amazon.com, Inc. — and when they’d sell — is the membership. See the Ticker Nerd 20 →

News

Latest AMZN news & analysis

UPS Stopped Carrying 2 Million Amazon Packages a Day. Amazon Still Has to Move Them.

The Motley Fool · 24 Aug 2026neutral

UPS eliminated roughly 2 million lower-quality Amazon packages per day from its network. Amazon's logistics arm delivered an estimated 6.7 billion US parcels in 2025, surpassing the volume handled by the US Postal Service.

Why it matters — AMZN watchers would care because it highlights the scale and growth of Amazon's in-house delivery network as it increasingly handles parcel volume independently of external carriers like UPS.

Walmart Aims to Take On Amazon With Trendier Apparel

PYMNTS · 24 Aug 2026negative

Walmart is reportedly launching a new clothing line, the Scenario brand, with most items priced under $25, aimed at attracting younger consumers. The move is part of Walmart's effort to regain ground from Amazon in apparel while appealing to its core discount shoppers.

Why it matters — A competing retailer stepping up its apparel offerings signals increased competition for Amazon in the clothing segment.

Amazon's Toaster-Shaped Robotaxis Are Hitting the Road

WSJ · 23 Aug 2026positive

Amazon is the first company to charge for rides in its autonomous vehicle, which is described as toaster-shaped and lacks a steering wheel, dashboard, or pedals. The self-driving vehicles are now hitting the road.

Why it matters — This marks a milestone in Amazon's autonomous-vehicle efforts, showing its robotaxi service is moving from development into commercial operation.

Oracle vs. Amazon: Which Is the Better AI Cloud Stock to Own for the Next 5 Years?

The Motley Fool · 23 Aug 2026neutral

An article compares Oracle and Amazon as AI cloud stocks for the next five years. It notes Amazon operates a diverse business that pioneered cloud computing, though its rising capital expenditures have strained its balance sheet, while Oracle's lower-cost infrastructure depends heavily on OpenAI.

Why it matters — AMZN watchers would care because the piece weighs Amazon's cloud leadership and diversification against the financial strain of its growing capital expenditures.

This is One of the Cheapest Magnificent Seven Stocks Right Now

24/7 Wall Street · 23 Aug 2026positive

The article notes that Amazon has quietly become one of the most reasonably priced names among the Magnificent Seven, with a forward valuation multiple that looks modest relative to its pace of growth.

Why it matters — AMZN watchers would care because the report highlights Amazon's valuation as comparatively attractive against its Magnificent Seven peers.

FAQ

Frequently asked questions about AMZN stock

What is the AMZN stock price forecast for 2026-2027?

The 60 Wall Street analysts covering Amazon.com, Inc. have a median 12-month price target of $325, with estimates ranging from $230 to $405. These are third-party analyst estimates, not Ticker Nerd forecasts, and they are frequently wrong.

Is AMZN stock a buy right now?

Of the 60 analysts covering Amazon.com, Inc., 58 rate it a Buy, 2 a Hold and 0 a Sell. Ticker Nerd's systematic factor model ranks Amazon.com, Inc. 49 out of 100 across roughly 4,600 US stocks as at 22 Aug 2026. None of this is personal advice — it does not consider your circumstances.

How does Ticker Nerd's model rank AMZN?

As at 22 Aug 2026, Amazon.com, Inc. ranks 49 out of 100 on Ticker Nerd's systematic factor model — a percentile across roughly 4,600 US stocks, built from its factor families. Its strongest factor family is Revisions (93 of 100).

Will AMZN stock go up?

No one can know that. What the data says: the median 12-month target from 60 analysts implies +25.7% from the last close, and Ticker Nerd's factor model ranks Amazon.com, Inc. 49 out of 100 as at 22 Aug 2026. Analyst targets are third-party estimates and frequently wrong; none of this is personal advice.

What is the AMZN stock forecast for 2030?

No analyst covering Amazon.com, Inc. publishes a 2030 price target — Wall Street targets run 12 to 18 months out. Sites quoting a 2030 price for AMZN are extrapolating price history, which says nothing about the business. The furthest attributed numbers are the current analyst targets: $230 to $405 over the next 12 months.

How has AMZN stock performed over the past year?

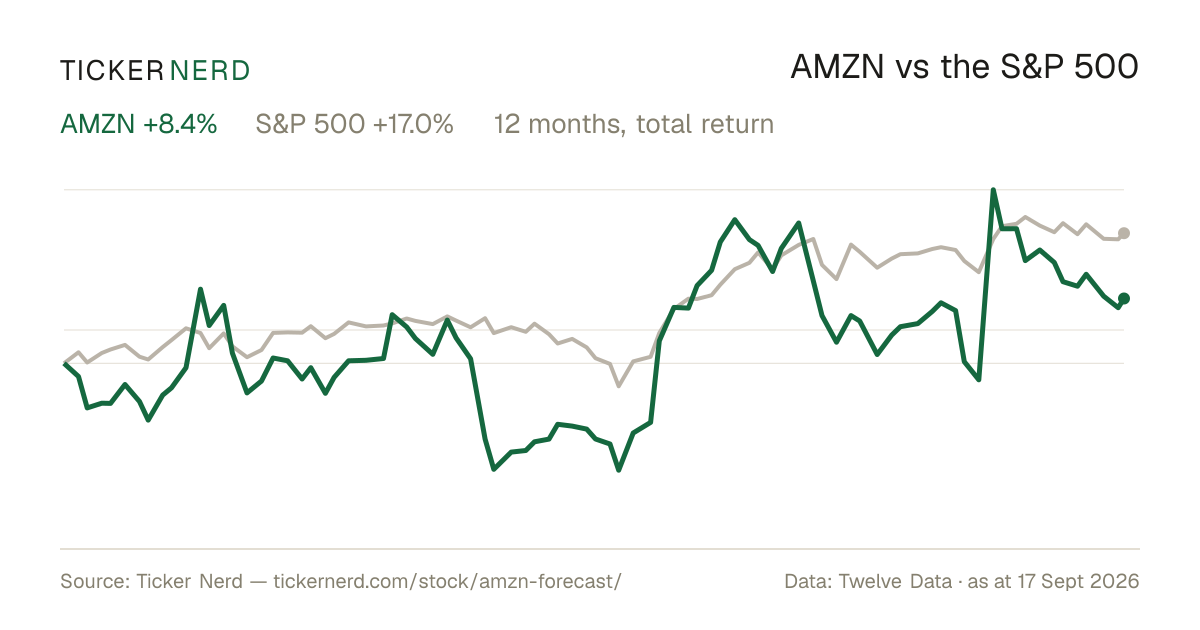
Amazon.com, Inc. returned +16.5% over the 12 months to 21 Aug 2026, with dividends reinvested. Past performance does not indicate future returns.

What does Amazon.com, Inc. do?

Amazon.com runs one of the world's largest e-commerce marketplaces, selling goods directly and through third-party sellers, with a Prime subscription program, fast delivery, and a logistics network. Amazon Web Services is a major cloud platform that companies use for computing infrastructure, storage, and application deployment.

What is the latest news on AMZN?

The most recent item we track (The Motley Fool, 24 Aug 2026): "UPS Stopped Carrying 2 Million Amazon Packages a Day. Amazon Still Has to Move Them.". UPS eliminated roughly 2 million lower-quality Amazon packages per day from its network. Amazon's logistics arm delivered an estimated 6.7 billion US parcels in 2025, surpassing the volume handled by the US Postal Service.

Why do Amazon's earnings and its cash flow diverge?

In the March 2026 quarter, net income was $30.3 billion while free cash flow was negative $18.2 billion, because capital expenditure of $43.2 billion ran ahead of operating cash flow of $26.0 billion. That gap is why our Investment/Accruals factor ranks only 22.1 of 100: it reads profit that has not yet arrived as cash.

Company

About Amazon.com, Inc.

Amazon.com runs one of the world's largest e-commerce marketplaces, selling goods directly and through third-party sellers, with a Prime subscription program, fast delivery, and a logistics network. Amazon Web Services is a major cloud platform that companies use for computing infrastructure, storage, and application deployment. The business also sells digital advertising, streaming entertainment such as Prime Video, and smart-home hardware. It employs about 1,595,000 people worldwide.

CEO Mr. Andrew R. Jassy · 1,595,000 employees · United States · https://www.amazon.com