StockAnalysis.com Review (2026): Is Pro Worth $79 a Year?
Free covers 130,000+ stocks and ETFs and a 317-filter screener. Pro is $79 a year for up to 40 years of history, exports and alerts. Who should skip it.
 By Aslam Ghouse, CFA · Ex-Goldman Sachs systematic trader · Updated 16 Sept 2026
- Our rating
- 4.5 / 5
- Price
- $79 a year or $9.99 a month; Unlimited is $199 a year or $29 a month; the free site needs no account
- Trial
- None. The free site is the trial
- Refund
- 60-day money-back guarantee, no questions asked, by email to support
- Best for
- Investors who read financial statements and want 10 to 40 years of them, in a spreadsheet, for under $7 a month
We earn a commission if you subscribe through this link, at no extra cost to you. It has no bearing on what the model ranks or what we cover.
Some links in this article are affiliate links. How we get paid · How we review.
StockAnalysis.com covers 130,000+ stocks and ETFs. Anyone can read five years of financial statements with no account. Pro costs $79 a year, extends the history to between 10 and 40 years, and turns on exports and alerts. The site says more than 5 million investors use it each month. Every price and term below was checked on stockanalysis.com on 16 September 2026.
My take: the best data for the money sold to private investors. The free site does what most people pay Seeking Alpha or Morningstar for. Pro at $79 earns its price the day you want more than five years of history or the numbers in a spreadsheet.
It shows you everything about a company and decides nothing, so the judgment stays yours. A desk terminal costs five figures a year, and a private investor only ever uses four things on it. Those are financial statements back through a full cycle, consensus estimates (the average of analysts' forecasts), a screener across the whole market, and an export to a spreadsheet. StockAnalysis.com does those four for $79 a year. It does not replace the rest of the terminal. There is no API (no way for other software to pull the data), nothing on options or bonds, and no model of your own portfolio's risk. Judge it on the four.
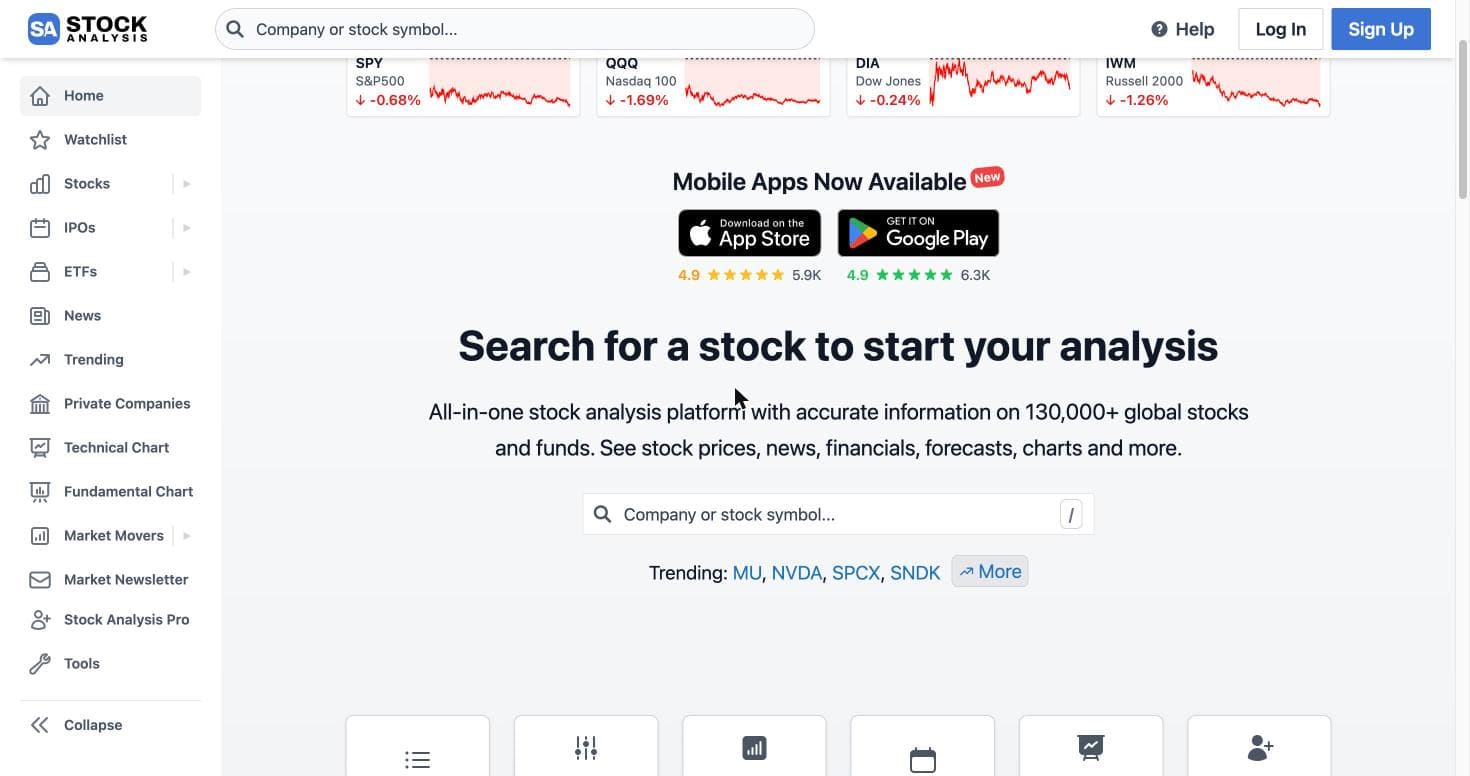
The homepage: search a ticker, get the data. No login wall.
What StockAnalysis.com is
StockAnalysis.com is a financial data site. Kris Gunnars founded it in 2019; Kris Gunnars is the pen name of Kristjan Mar Gunnarsson. The owner is Vefir ehf., a private company registered in Kópavogur, Iceland. The About page names a team of six, including an accountant who manages IPO data and quality control.
The product is a page per ticker with the statements, ratios, dividends, analyst targets, earnings transcript and news. Around it sit the tools: a stock screener, an ETF screener with holdings, and IPO calendars and lockup dates (when insiders may first sell). There is also an earnings calendar, market movers and heatmaps, and analyst profiles. A fundamental chart plots any line item over decades, and there is a daily Market Bullets newsletter. The site funds itself with ads on the free tier and with Pro subscriptions.
It makes no calls of its own. The help centre answers "Do you make stock recommendations?" with a flat no. It collects Wall Street analysts' ratings, changes none of them and issues none of its own. That stance is why we cite its IPO calendars and statistics on our own IPO pages.
The changelog is public and has an entry most working days. In the first week of September 2026 alone, the heatmaps gained a size picker and the screener's numeric filters gained an "include N/A values" switch. Analyst profiles gained sortable stock tables. On 31 August the cash flow statement gained lease payments and free cash flow after leases, for companies that report under the IFRS 16 lease rule. A six-person team shipping at that rate is the strongest argument for the site on this page.
StockAnalysis.com Pro cost (2026): $79 a year, $9.99 a month, Unlimited at $199
There are three tiers, two billing periods and one guarantee. Figures come from the vendor's Pro page and help centre, checked September 2026.
| Tier | Monthly | Annual | What the tier caps | Guarantee |
|---|---|---|---|---|
| Free | $0 | $0 | 5 years of financials, no downloads, ads | n/a |
| Pro | $9.99 | $79 ($6.58 a month) | 1 download a day, 100 stocks per watchlist, 100 alerts, 25 analyst follows | 60-day money back |
| Unlimited | $29 | $199 ($16.58 a month) | None of Pro's caps | 60-day money back |
The Pro page prints Unlimited as $16.58 a month billed annually, not as a yearly total. Over twelve months that is $199, the same way Pro's $6.58 a month is $79.
- Free is the right tier for anyone who checks a company's shape a few times a month. Five years of statements, the full screener and the ETF pages are there with no account.
- Pro is the tier for almost everyone who pays. The long history, the export and the alerts are the product. Annual billing saves 34% against monthly.
- Unlimited exists for people who download data every day, run watchlists past 100 names or hold hundreds of alerts. The help centre says those three caps are the only difference. Buy it for the caps, or stay on Pro.
On discounts, the help centre answers "Do you offer any discounts?" with annual billing: 34% off on Pro and 43% on Unlimited. No coupon appears anywhere on the vendor's pages, and our link carries none. If another review site shows a percentage-off banner, check it at checkout before you count on it.
There is no free trial, because the free site is the trial. You buy Pro and ask for a refund if it is wrong for you. The guarantee runs 60 days, no questions asked, by an email to support from the account address. Refunds are not automatic when you cancel, so send the email. Subscriptions renew automatically until you cancel from the account page. A cancelled subscription runs to the end of its paid period.
Or $9.99 month to month. 60-day money-back guarantee, no questions asked. Prices checked September 2026.
Is StockAnalysis.com Pro worth it?
Put the fee against what the free tier already gives you, because that is the real comparison. Free shows five years of every statement; Pro shows up to 40. Free lets you read the numbers; Pro lets you download them, once a day. Free gives you a watchlist; Pro gives you unlimited watchlists, brokerage sync and 100 alerts. That is $6.58 a month for three upgrades. A wrong purchase costs one email to undo.
Worth it if you read statements back through at least one recession, want the numbers in a spreadsheet, or track more than a handful of names with alerts. It is also worth it if you want your brokerage holdings synced beside the data. Any one of those pays the $79.
Skip it if you look up a company a few times a month, because free covers that. Skip it too if what you want is someone's view of the stock, which the site does not sell at any tier. Skip Unlimited unless you download data most days. The other Pro caps are generous.
What you get free, and what Pro adds
The free tier needs no account and includes most of what a long-term investor uses:
- Full financial statements, income, balance sheet and cash flow, with ratios and margins, five fiscal years plus the trailing twelve months (the last four quarters added up)
- A stock screener with 317 filters across every listed stock, results in a second
- ETF pages with holdings, and an ETF screener
- IPO calendars, lockup expiries and statistics
- Analyst price targets and consensus ratings per stock, with the individual analysts' records
- Earnings call transcripts, market movers, heatmaps and a fundamental chart
- A saved watchlist, once you create a free account
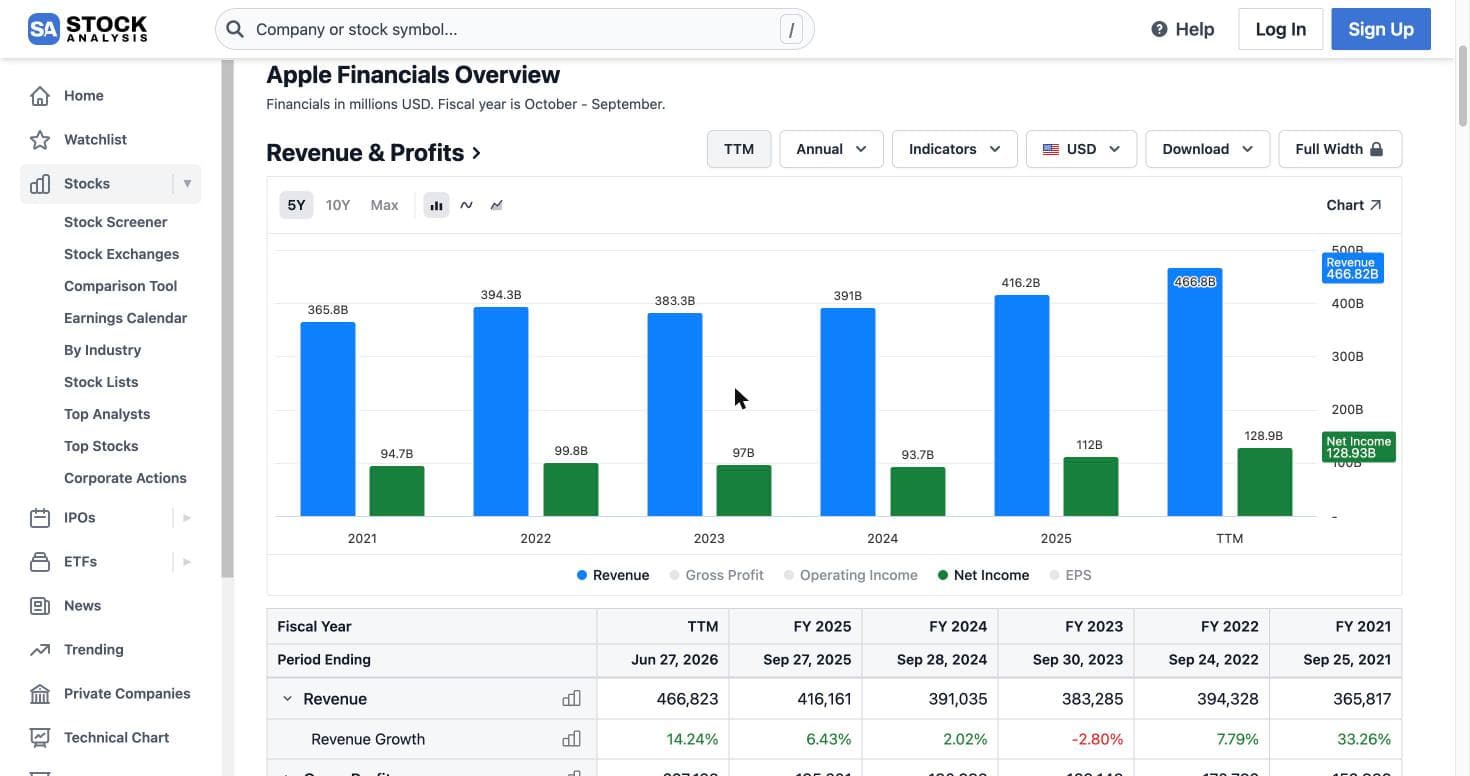
Five years of Apple's financials, chart and table, on the free tier.
The catch on free is depth. History stops at five years, exports are locked, and ads run.
Pro adds, per the vendor's Pro page:
- 10 to 40 years of financial history, depending on the data source you select, and 10 to 50 years of dividend history
- The complete history of business metrics for 50,000+ stocks: segment revenue, unit counts and the operating figures companies report beside the statements
- One download a day to Excel, CSV or Google Sheets
- Unlimited watchlists and portfolios, 100 stocks per watchlist, with holdings synced from a brokerage account through SnapTrade, which connects 25+ brokers
- 100 active alerts and the ability to follow up to 25 analysts and be told when they publish
- Saved screeners, 300+ indicators in data tables and up to 1,000 rows per table
- Full ETF holdings and corporate actions, advanced analyst filtering, top-analyst forecasts
- No ads, dark mode, and a setting to hide paywalled news sources from a stock's news feed
Why the history matters: two years of numbers say almost nothing about how a business behaves through a cycle. Five say little more. Margins across two recessions do. Most sites stop at five years or charge terminal prices for more.
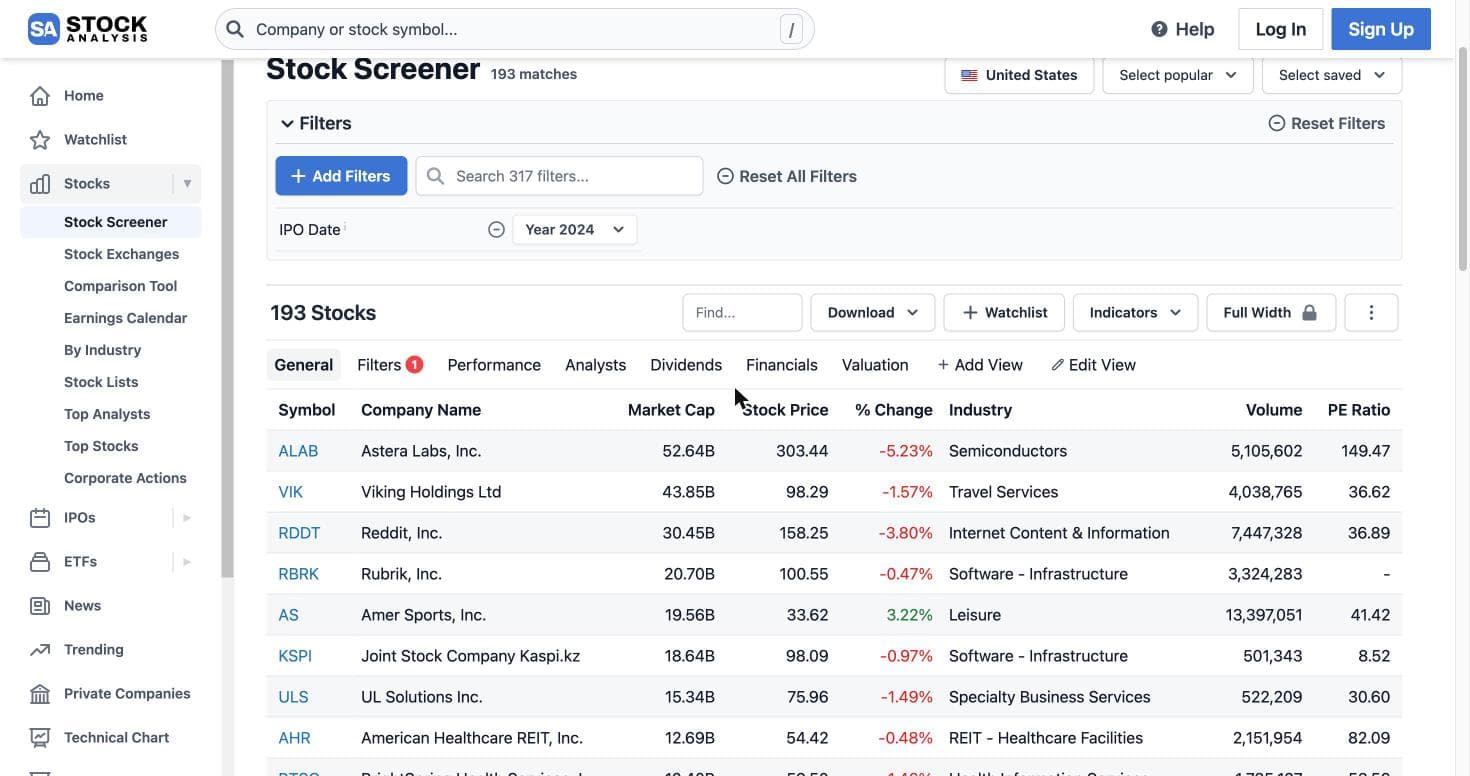
The screener: 317 filters, instant results. Here, every 2024 IPO.
The app is real and recent. Stock Analysis has a native app for iPhone and iPad on the App Store and for Android on Google Play. Each showed a 4.9 rating on the vendor's site in September 2026, and the iOS build installs on a Mac. Windows users install the site from the Microsoft Store. The free tier works in the app. Pro can be bought in-app, but Apple or Google then handle the refund under their own rules.
10 to 40 years of financials, one export a day, 100 alerts, brokerage sync. Unlimited lifts the caps for $199.
Is StockAnalysis.com reliable? Where the data comes from
The site publishes its sources on a Data Sources page, last updated 14 June 2026, and a Financial Sources page that grades them. That is more than most retail data sites disclose. It is the basis for judging reliability.
| What | Provider | Updates | History |
|---|---|---|---|
| Financial statements, default | Fiscal AI (US, Canada, Europe) | Minutes after earnings | 20 years |
| Financial statements, screener and alternative | S&P Global Market Intelligence | 1 to 3 hours after earnings | 10 years (5 free) |
| Longer US history, corporate actions | Nasdaq Data Link (Sharadar) | After the 10-Q or 10-K is filed | 30+ years |
| Longer global history, download fallback | Financial Modeling Prep | Varies | 40+ years |
| Real-time prices | CBOE, with 15-minute delayed consolidated tape from Nasdaq UTP | Live | |
| Price targets, consensus, forecasts | S&P Global; individual analyst records from TipRanks | ||
| ETF holdings | Finnhub, FMP fallback | ||
| Transcripts | Quartr | Minutes to hours after the call |
A person reviews every ticker added to the site before it goes live. The vendor runs scans and spot checks for stale or missing data, and every reported error gets a manual review. The vendor grades its own providers, and rates Financial Modeling Prep "High" where the other three are "Very High".
The gaps, plainly, all documented by the vendor:
- The screener and the statement pages use different providers. The screener runs on S&P Global; statement pages default to Fiscal AI. A line item can differ slightly between the two, and the vendor has no timeline for unifying them.
- Downloads may come from a different provider than the page. S&P Global does not permit downloads, so exports of US financials come from Fiscal AI or Nasdaq Data Link. They can mismatch the on-screen figures or use different line-item names. Some screener fields sourced from S&P cannot be downloaded at all.
- Quarterly cash flow lags. When a press release omits it, the figure waits for the 10-Q quarterly filing, a few days to a few weeks after earnings.
- Free history is capped by licence. The five-year limit on free is an S&P Global term. The 10-year cap on Pro's S&P data is why the longer series come from other providers via the data-source dropdown.
- International prices are 15-minute delayed or end-of-day depending on the exchange; US prices are real-time.
- No API, so no way for your own software to pull the data. The vendor licenses the data to display, not to pass on.
Legitimacy is a shorter answer. The company is registered, the staff are named and the data providers are stated. The site's own disclaimer calls its forecasts analysts' predictions that are often wrong. It is reliable for what it is: the numbers as reported, from the providers institutions pay, with the differences written down.
StockAnalysis.com vs Seeking Alpha
Different products at different prices. Seeking Alpha Premium is $299 a year list, or $269 the first year, with a 7-day trial and no refunds. It sells the argument: a daily quant rating (a computer score) on every US stock, grades on traits like value and growth, and thousands of contributor articles for and against. StockAnalysis.com sells the numbers with no opinion attached, for $79. Seeking Alpha's financials pages are adequate. StockAnalysis.com's are better and go back further. Investors who form their own view from the statements need only this site. Investors who want a rating to react to buy Premium, and many run both.
StockAnalysis.com vs Stock Rover
Stock Rover is the specialist screener: 800+ metrics, 20 years of fundamentals, screens written as formulas and a 14-day Ultimate trial. It costs from $29 a month on annual billing ($348 a year) up to $948 for Ultimate. It covers North American stocks only, has no mobile app, and gives no refunds under any circumstances. StockAnalysis.com covers 130,000+ symbols worldwide, screens on 317 filters, has an app and a 60-day refund, and costs $79 a year. A screener-first investor who builds screens with several conditions and ranks the output will find Stock Rover's depth worth four times the price. Everyone else starts here, and so does anyone who invests outside North America.
- Five years of statements, a 317-filter screener and ETF holdings free, with no account
- Pro at $79 a year is the cheapest serious data tier at retail, with 10 to 40 years of history
- Sources are published and graded: S&P Global, Fiscal AI, Nasdaq Data Link, CBOE, TipRanks
- One export a day to Excel, CSV or Google Sheets; brokerage sync across 25+ brokers
- Native iOS and Android apps, and a public changelog with entries most working days
- 60-day money-back guarantee, by one email
- No picks, no model portfolio, no written research
- Screener and statement pages run on different providers, so line items can differ
- Downloads can come from a different provider than the page and mismatch it
- No API, nothing on options or bonds
- Fewer screening factors than Stock Rover; no equation screens
- Pro's one-download-a-day cap pushes heavy exporters to Unlimited at $199
StockAnalysis.com vs Ticker Nerd
Different jobs. StockAnalysis.com gives you the numbers on any company; Ticker Nerd gives you a finished portfolio that rules maintain.
| StockAnalysis.com | Ticker Nerd | |
|---|---|---|
| What you get | Data on 130,000+ stocks and ETFs, screener, exports | The Ticker Nerd 20, a rules-run portfolio of twenty stocks |
| Who decides | You | Published rules over a ranked ~1,500-stock universe; the model buys and sells |
| Cadence | Always on; financials update within minutes of earnings | Reviewed every four weeks, with a plain-English brief per holding |
| Record | n/a; it makes no picks | On the join page: every trade since live, losers included |
| Price | $79/yr, free tier without an account | $199/yr |
The short version: if you enjoy the research and want the raw material, get Stock Analysis Pro. If you want the portfolio decided by a system and explained in plain English, that is what membership is. Checking the twenty names yourself with StockAnalysis.com open in the next tab is a good way to work.
Verdict: is StockAnalysis.com Pro worth it in 2026?
Yes, at $79, for anyone who reads financial statements. The free tier already covers the casual case and beats several paid products. Pro's long history, daily export and alerts are the parts a serious reader reaches for within a month. The $6.58 a month is less than the time the ads it removes would cost you.
There is no opinion on the site and none for sale. If you need a view handed to you, Seeking Alpha sells one and Ticker Nerd runs one. If you need formula screening, Stock Rover is the deeper tool at four times the price. As the data layer under a private investor's research, StockAnalysis.com is the current best buy. The 60-day guarantee means finding out whether you agree costs one email.
Quick answers.
Is StockAnalysis.com free?
Yes. Without an account you get stock pages for 130,000+ stocks and ETFs, with five years of income statements, balance sheets and cash flows. You also get a 317-filter screener, ETF holdings, IPO calendars and analyst price targets. A free account adds a saved watchlist. The limits are five years of history, ads, and no downloads. Pro removes all three for $79 a year.
What does Stock Analysis Pro add?
Pro extends financial history from five years to between 10 and 40, depending on the data source. It adds 10 to 50 years of dividend history and one download a day to Excel, CSV or Google Sheets. You get unlimited watchlists and portfolios with 100 stocks each, brokerage sync, 100 price alerts and saved screens. Tables gain 300+ indicators and up to 1,000 rows. Pro also adds full ETF holdings and corporate actions, dark mode, and no ads. Unlimited lifts the download, watchlist-size and alert caps.
How much does Stock Analysis Pro cost?
Pro is $79 a year, or $9.99 month to month, checked on stockanalysis.com in September 2026. Unlimited is $29 a month or $16.58 a month billed annually, which comes to $199 a year. Annual billing is the only discount the vendor offers. There is no coupon. Both paid tiers carry a 60-day money-back guarantee. They renew automatically until you cancel from the account page.
Is StockAnalysis.com reliable and legit?
Legit: the owner is Vefir ehf., a company registered in Iceland. Kris Gunnars founded it in 2019, a named team of six runs it, and it issues no stock recommendations of its own. Reliable: the financial statements come from S&P Global Market Intelligence and Fiscal AI. Nasdaq Data Link and Financial Modeling Prep supply the longer history. Prices are real-time from CBOE, and price targets come from S&P Global and TipRanks. A person checks every new ticker. The known gaps are small and the vendor documents them. The screener still runs on S&P while statement pages default to Fiscal AI, so a few line items differ. Downloads can come from a different provider than the page you are looking at.
Does StockAnalysis.com have an app?
Yes. There is a Stock Analysis app for iPhone and iPad on the App Store and for Android on Google Play. Both showed a 4.9 rating in September 2026, and the iOS app installs on a Mac. Windows users can install the site as an app from the Microsoft Store. The free tier works in the app. Pro can be bought through the app stores, though refunds then go through Apple or Google rather than the vendor.
StockAnalysis.com or Seeking Alpha?
Different products. StockAnalysis.com is the numbers: statements, screener, estimates, exports, with no opinion attached, for $79 a year. Seeking Alpha Premium is the argument: a daily computer-scored quant rating on every US stock plus thousands of contributor articles for and against, at $299 a year list. If you form your own view from the financial statements, StockAnalysis.com covers you. If you want ratings and written cases to react to, Seeking Alpha has them. Plenty of investors run both.
StockAnalysis.com or Stock Rover?
Stock Rover for depth of screening, StockAnalysis.com for breadth and price. Stock Rover Premium is $29 a month on annual billing ($348 a year). It covers North American stocks only, has no mobile app and gives no refunds. Its 800+ metrics and formula-based screener have no rival at retail. StockAnalysis.com covers 130,000+ global symbols, has 317 screener filters, an app and a 60-day refund, for $79 a year. A screener-first investor buys Stock Rover. Everyone else starts here.
Can you get a refund on Stock Analysis Pro?
Yes, within 60 days of purchase, no questions asked. The refund is not automatic when you cancel. Email support@stockanalysis.com from the address on the account and the full amount comes back. Subscriptions bought through the Apple App Store or Google Play are refunded through Apple or Google under their rules. After 60 days you can cancel at any time and keep access to the end of the paid period.
The market re-ranks every week. Monday's email says what moved.
- Market Radar, every Monday: the week's biggest rank moves across ~4,600 US stocks, and the reason for each.
- The AI build-out map, free: every AI company we track, part by part, and one part in full with each verdict.