Stock Rover Review (2026): Is It Worth $29 a Month After V12?
Stock Rover costs $29 a month on annual billing, $34 monthly. Are 800+ metrics and 20 years of financial data worth it after V12, and which tier to buy?
 By Aslam Ghouse, CFA · Ex-Goldman Sachs systematic trader · Updated 16 Sept 2026
- Our rating
- 4.5 / 5
- Trial
- 14 days of the Ultimate tier, no card required; the account drops to the free plan when it ends
- Refund
- None, under any circumstances, by Stock Rover's own FAQ; cancel any time and keep access to the end of the paid period
- Best for
- Investors who run their own screens and read financial statements
We earn a commission if you subscribe through this link, at no extra cost to you. It has no bearing on what the model ranks or what we cover.
Some links in this article are affiliate links. How we get paid · How we review.
Stock Rover covers 8,500+ North American stocks with 800+ metrics and 20 years of financial history on its top tiers. Premium starts at $29 a month on annual billing. Version 12 shipped on May 31, 2026. The three months since brought a new dashboard, a portfolio performance report and fund reports on 20,000 mutual funds.
My take: the most thorough research tool a private investor can buy, and the most under-rated. If you run your own screens and read balance sheets, it earns its price several times over. If you want a tool that decides for you, it is the wrong purchase.
On a trading desk you see hundreds of numbers on one screen, and you learn to hate clicking through pages to find one. Most retail sites make you do that: a chart here, a summary there, and the figure you want three clicks away. Stock Rover puts everything in one table. That is the whole appeal. It is also why people who have used professional tools tend to like it more than first-time investors do. The free plan will tell you which side you are on within a week.
What Stock Rover is, in numbers
Stock Rover is a screener, comparison table, charting tool, research-report generator and portfolio tracker in one web app. A screener filters the whole market down to the stocks that meet your rules. Two software engineers founded the company in 2008. In the eighteen years since, it has added features rather than redesigned.
| Universe | 8,500+ stocks on seven North American exchanges, 7,000+ ETFs, 40,000+ mutual funds; OTC and ~6,000 more tickers on Ultimate |
| Metrics | 400+ on Premium, 700+ on Premium Plus, 800+ on Ultimate |
| Fundamentals history | 5, 10 or 20 years by tier; price history 10 or 20 years |
| Screeners | 150+ prebuilt; equation, historical and ranked screening from Premium Plus; percentile screening on Ultimate |
| Reports | Research reports on 7,000+ stocks; fund reports on 7,400 ETFs and 20,000 funds |
| Portfolios | Brokerage sync, performance attribution, rebalancing, income projection |
Prices, limits and policies below were checked on Stock Rover's plans page, FAQ and terms on September 16, 2026.
What Version 12 changed in 2026
V12 arrived on May 31, 2026, with new prices and two new top tiers. Here are the features that matter, with the tier that carries each one:
- 20 years of fundamentals (Ultimate and above). Fundamentals are the figures from a company's accounts: sales, margins, debt and cash. Ten years of them covers one market cycle. Twenty covers the 2008 crisis, the 2020 crash and the 2022 rate rises, so you can see how a company held up in each. If you care how a business behaves in a downturn, this is the headline feature.
- Percentile screening (Ultimate and above). Screen for stocks in the top 10% of the market on any of the 800+ metrics. You no longer have to guess a cut-off number.
- Options chains and option metrics (Ultimate and above). Option chains by expiry date and contract charts inside the Insight panel. Useful if you write covered calls. Nobody should buy Stock Rover as an options platform.
- Redesigned dashboard (August 26, 2026, all plans). The top shows market breadth, meaning how much of the market is rising or falling. It has the advance/decline ratio, new 52-week highs and lows, and the share of stocks above their 200-day average. Below that, a signals panel watches your holdings for seven triggers. An earnings calendar runs down the right side. The classic dashboard stays one click away.
- Portfolio Performance Report (August 5, 2026, all paid plans). One document that puts your money-weighted return (IRR) beside your time-weighted return (TWR). It adds a fee audit and a 12-month dividend forecast. Most brokerage statements show only one of the two returns.
- Fund Reports (July 9, 2026, full access on Ultimate and above). Seven-page reports on 7,400 ETFs and 20,000 mutual funds. Each covers holdings, tracking error (how far the fund strays from its index), tax efficiency and 20 years of payouts. Lower tiers get a dozen sample reports.
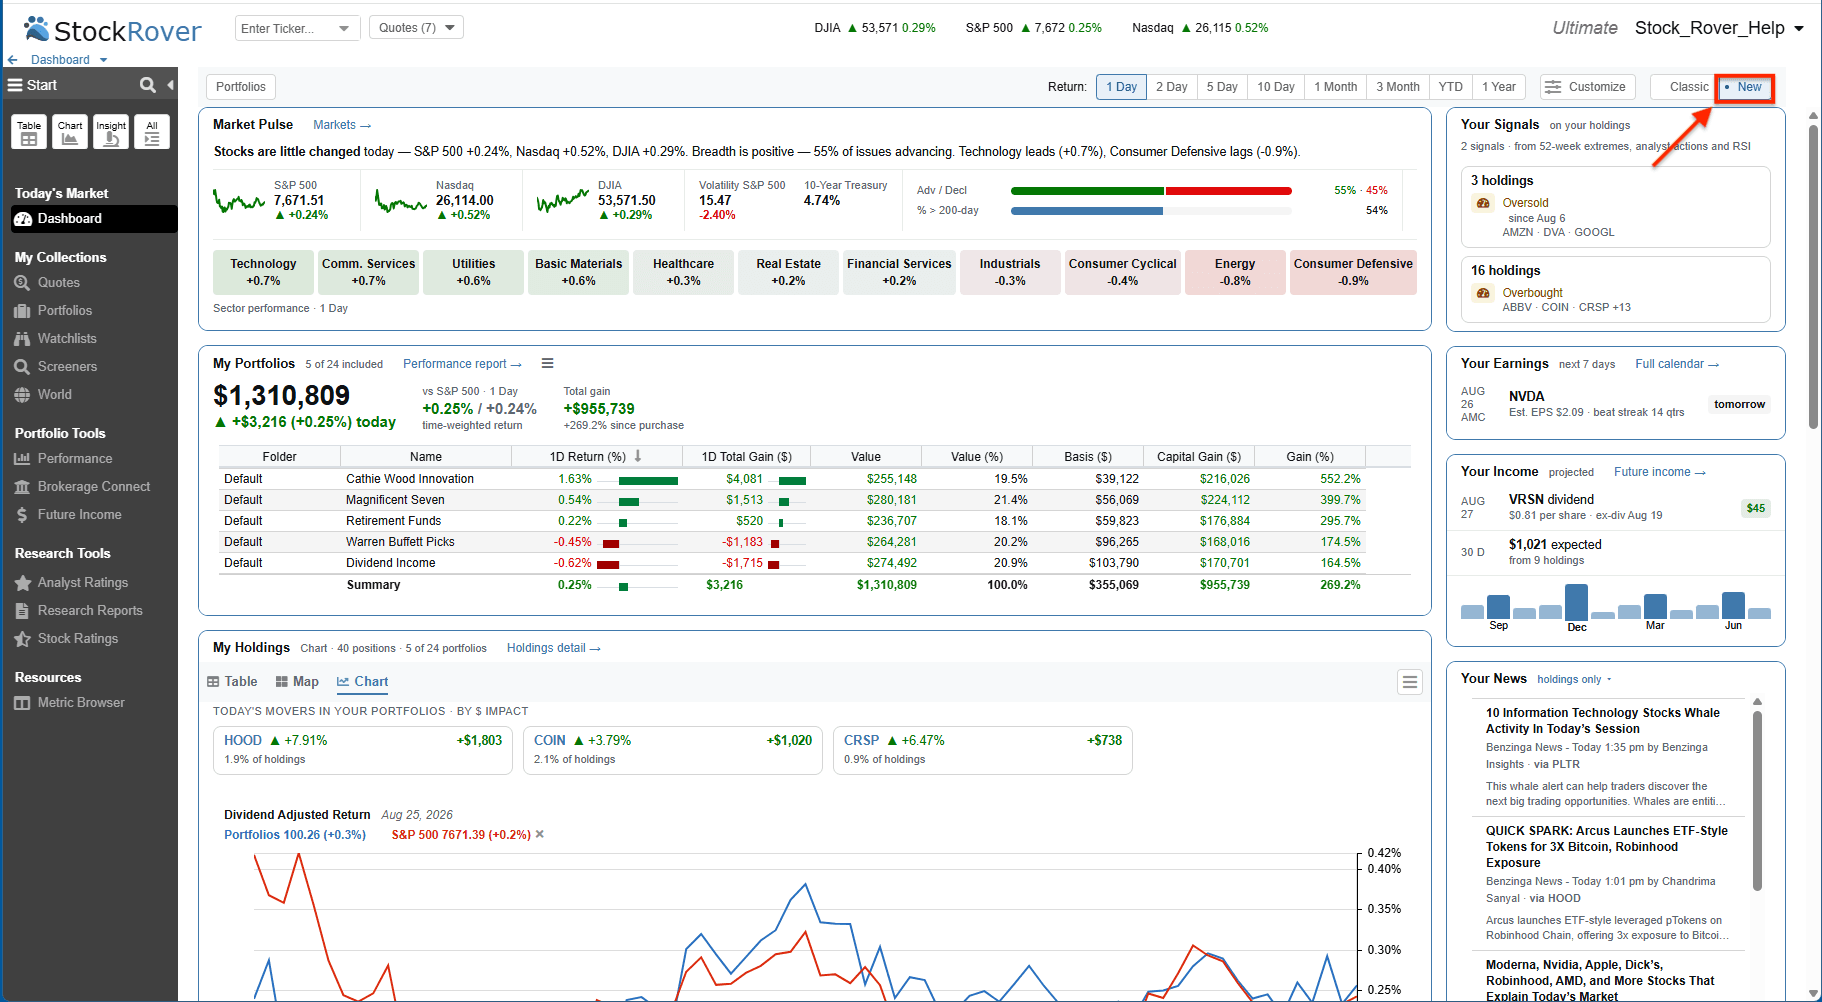
The August 2026 dashboard: breadth at the top, portfolios and holdings in the middle, earnings and income on the right. Source: Stock Rover.
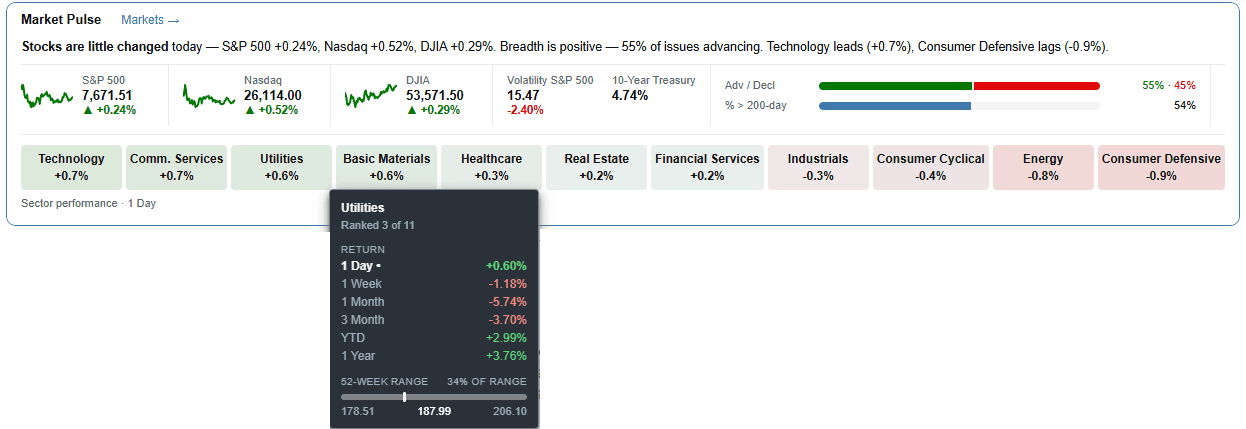
Market Pulse: advance/decline, new highs and lows, and the share of stocks above their 200-day average. Source: Stock Rover.
Screening: where Stock Rover beats everything sold to individuals
The screener is the reason to pay. Three things separate it from the free screeners at Finviz or your broker:
- Equation screening (Premium Plus and above). Write a formula across metrics and across time. "Operating margin above its own five-year average and rising for three years" is one line. On Ultimate the history runs twenty years.
- Ranked screens (Premium Plus and above). Give each rule a weight instead of a hard cut-off. A screen that ranks stocks by a weighted mix of value, quality and momentum is closer to how professional screens work than a pass/fail filter.
- Guru and factor screens (all paid plans). These are screens named after well-known investors and the ratios they used. The library of 150+ includes the Piotroski F-Score, Greenblatt's return on capital and earnings yield, the Graham number, the Shiller PE and the Sloan accrual ratio. You can edit every one.
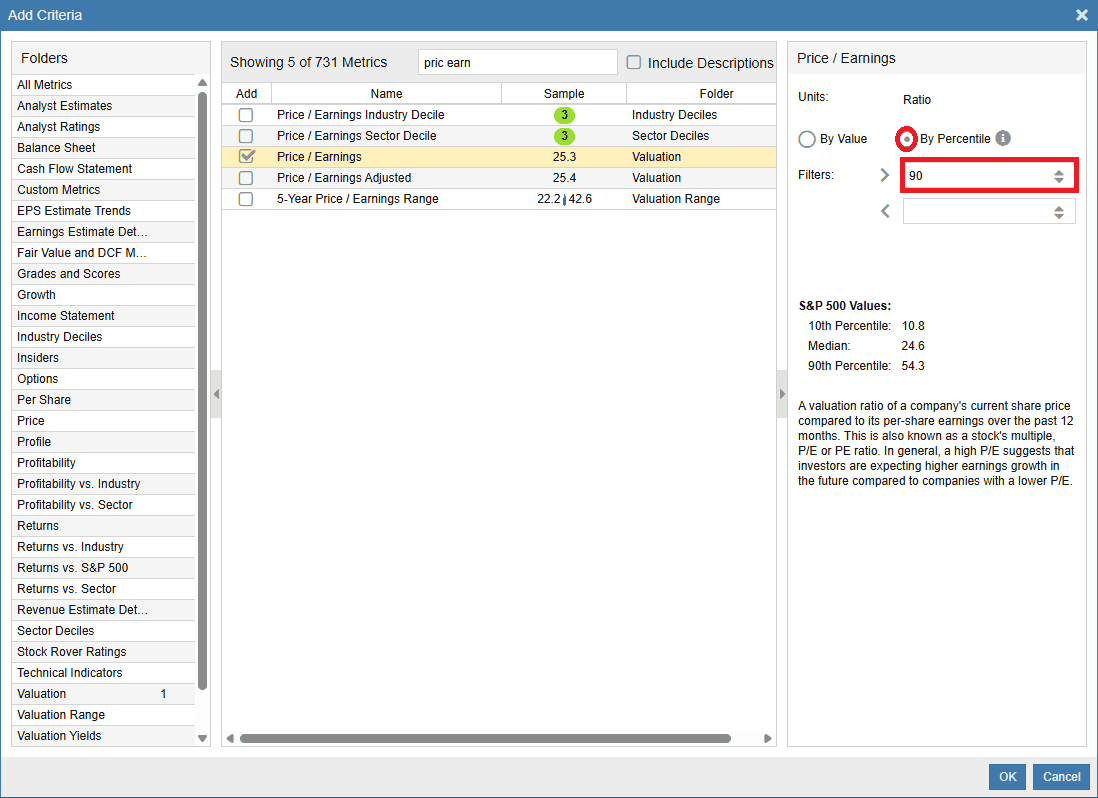
Percentile screening, new in V12: rank against the whole market instead of guessing a threshold. Source: Stock Rover.
Screen results land in the Table, a spreadsheet-style grid that fits 45 columns. One click swaps the set of metrics on show. This is the part of the product that feels like a professional terminal.
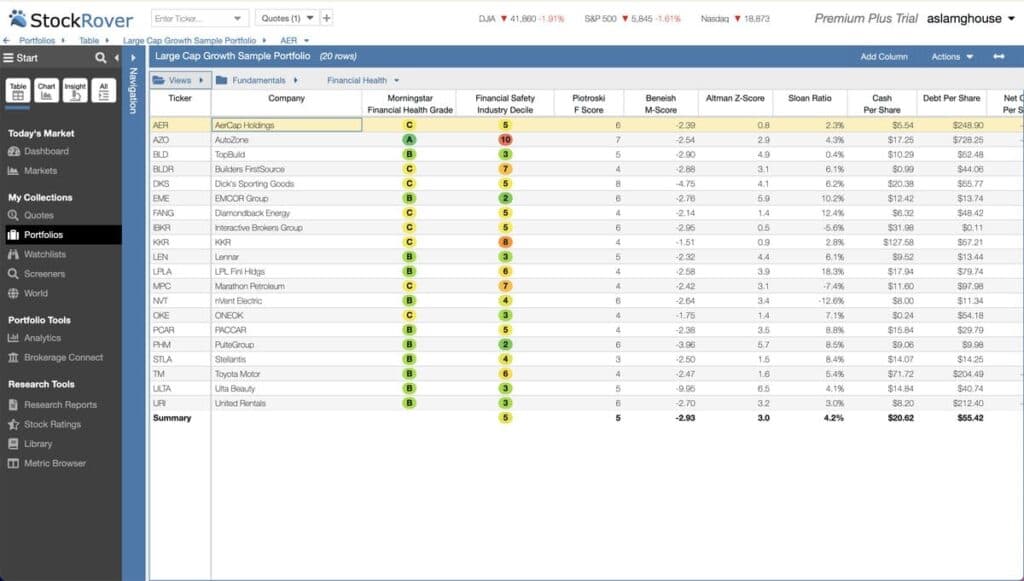
The Table: side-by-side comparison across any metric set, sortable and exportable.
What the screener does not do is backtest, meaning run a strategy through past years to see how it would have done. You can run a screen as of a past date, which is a useful check. You cannot follow a strategy through time. There is no API either (a way for other software to pull the data), so the only way out is a CSV export.
Equation, ranked and percentile screening on 800+ metrics. No card required.
Twenty years of fundamentals, charted
Fundamental charting is where the 20-year history pays off on screen. Chart revenue, margins or free cash flow against price over two decades. Overlay the valuation range and you see at a glance whether today's price is cheap against the company's own past. That is a better test than a peer group, which may itself be expensive.
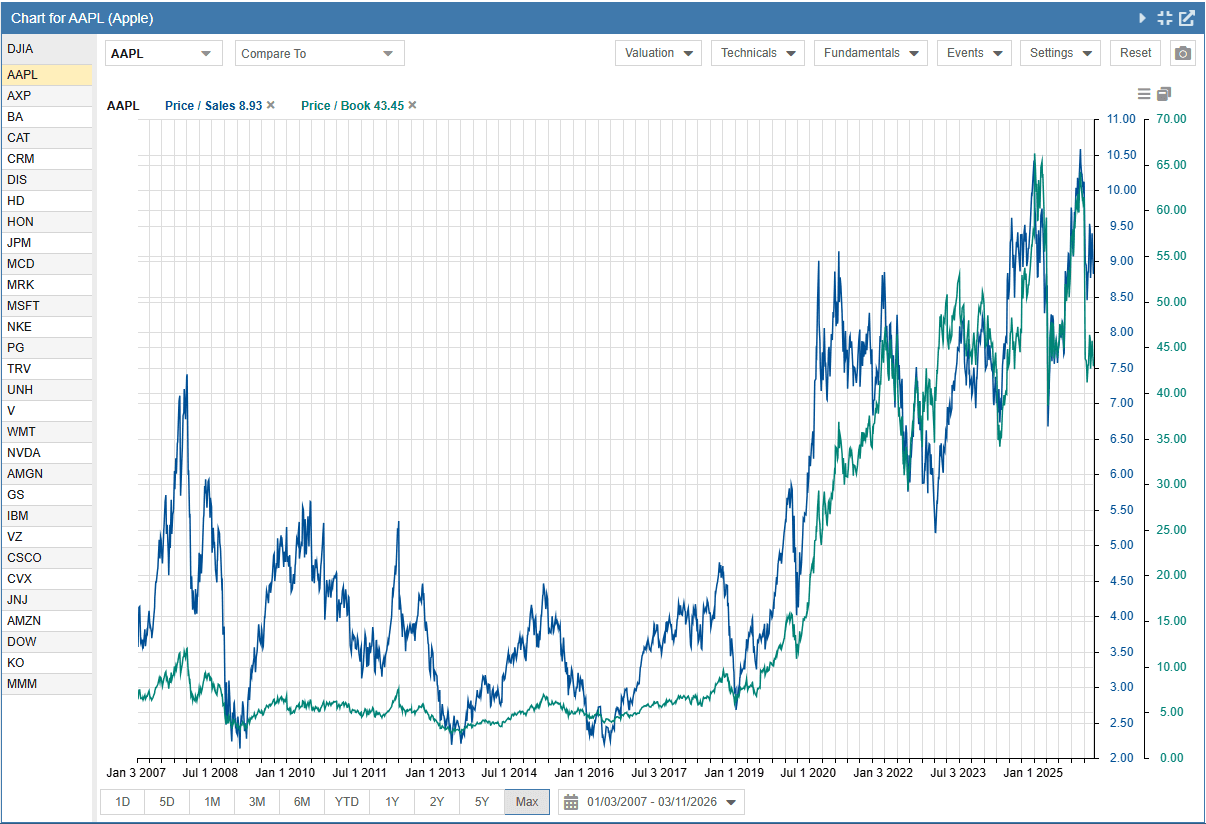
Twenty years of fundamentals on one chart, an Ultimate-tier feature since V12. Source: Stock Rover.
Research reports: an eight-page tear sheet on any of 7,000 stocks
Each report scores the company on quality, growth, value and sentiment. It states a fair value, meaning what the formulas say the shares are worth, and the gap between that and today's price, called the margin of safety. It flags investor warnings and lines the company up against its peers. Published formulas set the scores, which I prefer to an analyst's opinion. Reports are included from Premium Plus. On Premium they are a paid add-on.
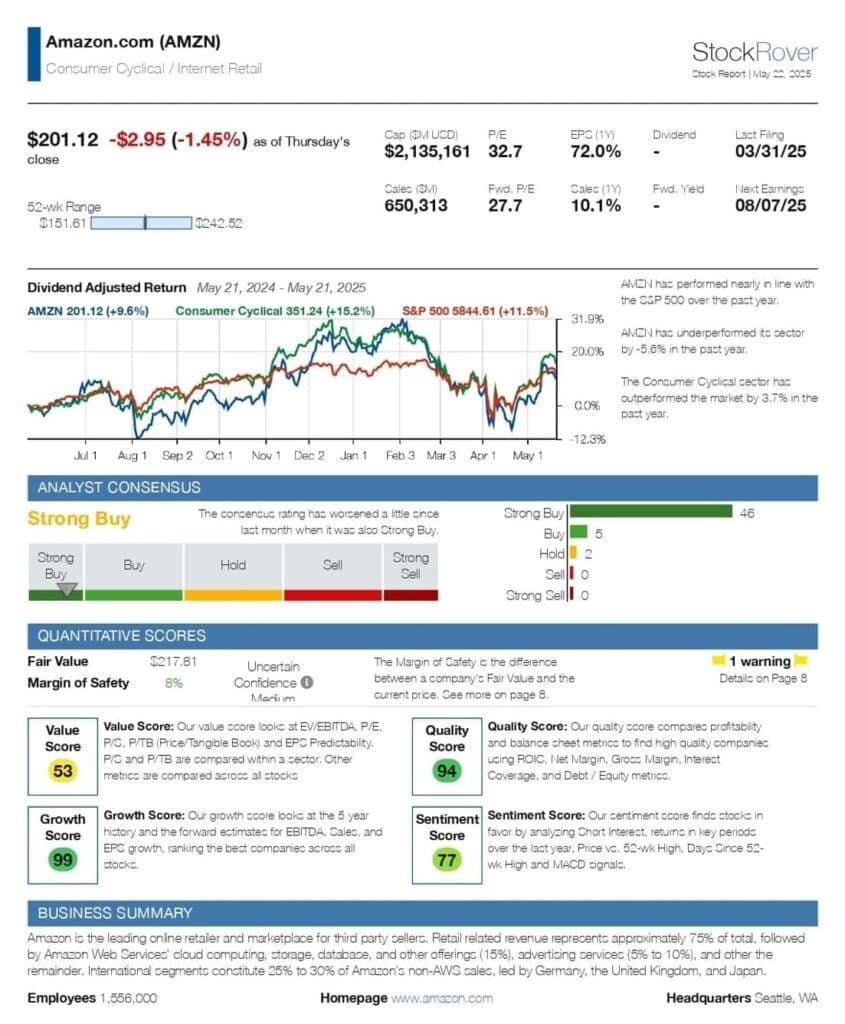
Page one of eight: scores, fair value and the warnings panel.
Portfolio tools and the new Performance Report
Connect a brokerage account and Stock Rover tracks every account in one place. It shows which holdings drove your return and how closely they move together. It plans a rebalance, meaning the trades that bring each holding back to its target weight. It also projects your dividend income. The August 2026 Performance Report packages this into one document.
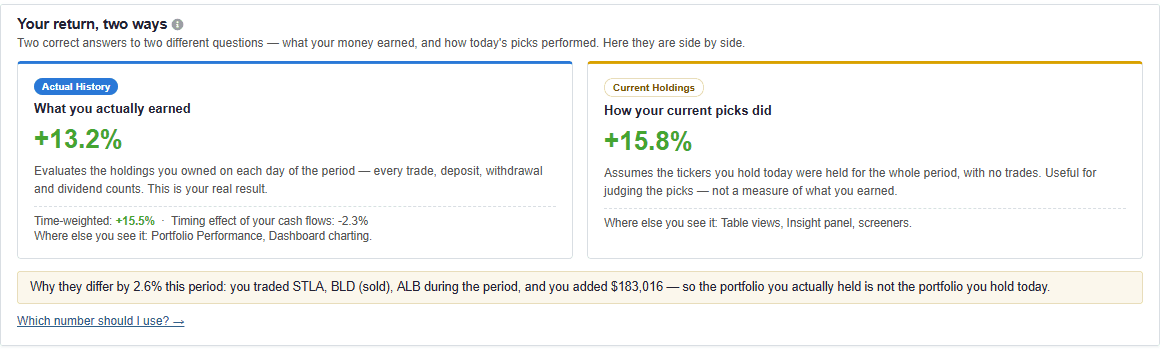
Money-weighted and time-weighted returns on the same page. Source: Stock Rover.
The difference matters more than it sounds. Your time-weighted return is what a fund manager would report. Your money-weighted return is what you earned after your own deposits and withdrawals. If the money-weighted figure is the lower one, your own buying and selling was badly timed. Most investors have never seen that number for their own account.
One caution from user reviews. Brokerage sync is the feature people complain about most, and holdings are sometimes matched to the wrong name. Check the first import against your statement before you trust the report.
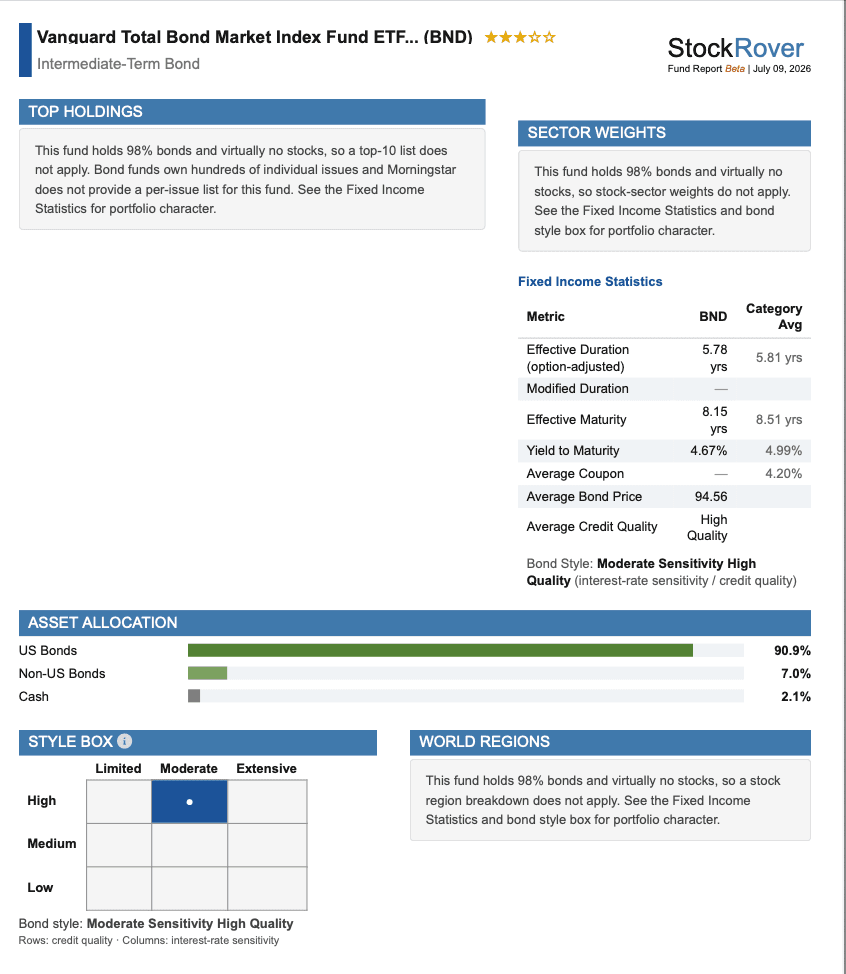
A fund report: holdings, cost, tracking error and 20 years of distributions on 7,400 ETFs and 20,000 mutual funds. Source: Stock Rover.
Stock Rover pricing (2026): which tier to buy
Prices from Stock Rover's plans page, September 2026. The headline "per month" figures assume you pay for a year up front. Month to month costs about a fifth more. Two-year billing takes a further 10% off.
| Tier | Month to month | Annual (per month) | Annual total | Two-year (per year) |
|---|---|---|---|---|
| Free | $0 | $0 | $0 | $0 |
| Premium | $34 | $29 | $348 | $288 |
| Premium Plus | $70 | $49 | $588 | $504 |
| Ultimate | $99 | $79 | $948 | $828 |
| Ultimate Pro | $199 | $149 | $1,788 | $1,548 |
What each tier adds:
| Premium | Premium Plus | Ultimate | Ultimate Pro | |
|---|---|---|---|---|
| Metrics / fundamentals | 400+ / 5 yrs | 700+ / 10 yrs | 800+ / 20 yrs | 800+ / 20 yrs |
| Screening | Filters on 300+ metrics | Equation, historical, ranked | Adds percentile and OTC | Bulk, high volume |
| Screeners / rows / portfolios | 15 / 250 / 15 | 30 / 500 / 25 | 120 / 1,000 / 60 | 300+ / 5,000+ / 300 |
| Research reports | Add-on | Included | Included | Included |
| Fund reports | Samples | Samples | Full | Full |
| Options chain | — | — | Yes | Yes |
| Quotes | Delayed | Delayed | Real-time where available | Real-time where available |
| Support | Phone hotline included | Priority hotline |
Which tier, in one line each:
- Premium if you want the comparison table, simple cut-off screening and five years of history, and will not miss formula screens. It suits someone who mainly tracks a portfolio and screens now and then.
- Premium Plus is the right tier for most readers. It has ten years of fundamentals, 700+ metrics, equation and ranked screening, and research reports included. Everything in the screening section above is here.
- Ultimate if the 20-year history, percentile screening, fund reports, options data or real-time quotes matter to you. Anyone who researches how a business behaved through 2008 wants this one.
- Ultimate Pro is for advisers running hundreds of portfolios. Individuals do not need it.
The 2026 repricing removed the old $7.99 Essentials tier, so the entry price roughly quadrupled. At $29 a month Stock Rover is no longer an impulse buy. It pays only if it becomes your main research tool.
Read before you pay: Stock Rover gives no refunds, under any circumstances, by its own FAQ. You can cancel whenever you like and keep access to the end of the paid period. Annual and two-year plans send a reminder 45 days before they renew. The sensible order is the free 14-day trial, then a monthly plan for a month or two. Move to annual or two-year once you know you will use it. You can move up to a longer billing period at any time.
Premium from $29 a month on annual billing, $34 month to month, or $288 a year on two-year. Every plan starts with the 14-day Ultimate trial.
The free plan and the 14-day trial
The free plan is a real product: basic data on every stock and fund the site covers, portfolio tracking with brokerage sync, basic charts and news. It is enough to follow a portfolio and to learn the interface.
Every new account opens with 14 days of Ultimate, no card required, with email support. The trial holds back CSV export of the Table, which is a licensing restriction. It caps research reports at 20 plus the Dow 30. During the trial you can switch between the Premium, Premium Plus and Ultimate feature sets to see which fits. When it ends, the account drops to the free plan rather than to a bill. So there is no reason not to try it.
Who should use Stock Rover, and who should not
Stock Rover is for you if:
- You screen for your own ideas. Equation, ranked and percentile screening over 800+ metrics is the product. If you never write a screen, you are paying for a comparison table.
- You read financial statements. Twenty years of fundamentals on one chart is what the $79 tier buys. It is wasted on anyone who stops at the price-to-earnings ratio.
- You track a portfolio across accounts. Brokerage sync, a breakdown of where your return came from, and the Performance Report replace the spreadsheet most people stop updating by March.
Skip it if:
- You want picks. Stock Rover scores stocks by formula and never tells you what to buy. A picks service or a rules-run portfolio is the product you are describing.
- You invest outside North America. It covers seven US and Canadian exchanges plus OTC stocks, which trade off-exchange. Nothing listed in London, Sydney or Singapore.
- You research on a phone. It is a web app built for a wide monitor, with no phone app. The tables need a screen that fits 45 columns.
Where Stock Rover falls short
- Learning curve. The first week is a wall of menus. Getting from a screen's results back to the screen takes a while to feel natural. Stock Rover's video library is good, and most users are fluent within two weeks. There is no shortcut.
- Dense, dated interface. The 2026 dashboard modernised the front door. The rest of the app is still built for a wide monitor. That is deliberate, and it is why so much data fits on one screen. Reviewers who want it to look like a consumer app mark it down for this. I would not.
- North American coverage only. Seven US and Canadian exchanges plus OTC. Investors in London, Sydney or Singapore will find their local names missing.
- Not for trading. Real-time quotes are an Ultimate feature. Canadian and micro-cap names lag 15 minutes on any plan. There is no order entry, and the chart-pattern tools are basic beside TradingView.
- No backtesting and no API. A screen as of a past date is as far as it goes.
- No refunds. See the pricing section. The 14-day trial is your only chance to try before paying.
- No mobile app. The site works in a phone browser; the tables do not.
- 800+ metrics and 20 years of history on the top tiers
- Equation, ranked and percentile screening that no other retail tool matches
- Research and fund reports scored by published formulas
- Performance Report shows money-weighted and time-weighted returns together
- 14-day Ultimate trial with no card; free plan afterwards
- Entry price quadrupled in the May 2026 repricing
- The 20-year history and percentile screening start at $79 a month
- North American stocks only
- Web only; dense tables need a wide screen
- No refunds, and no backtesting of screens
Stock Rover vs Seeking Alpha
The most searched comparison, and the two products do different jobs. Stock Rover is a data tool: 800+ metrics, 20 years of fundamentals and equation screening, with the opinion left to you. Seeking Alpha Premium is an opinion tool. It gives a quant rating on every covered stock, meaning a score a computer sets from the numbers. It has thousands of contributor articles arguing both sides, and earnings call transcripts. Its screener and financials are built around the quant grades rather than raw metrics, so screening is a side feature there. It lists at $299 a year against Stock Rover's $348 to $948 for the tiers most people buy.
| Stock Rover | Seeking Alpha Premium | |
|---|---|---|
| What it is | Screener, data and reports | Ratings, written analysis and community |
| Core strength | 800+ metrics, 20 years of history, equation screening | Quant ratings plus thousands of contributor articles |
| Opinion | Formula-driven scores, no written view | Bull and bear cases written by named authors |
| Screening | Deepest at retail | Adequate, built around the quant grades |
| Price | $348 to $948 a year for the tiers most people buy | $299 a year list price |
| Best for | Investors who build their own view from the numbers | Investors who want to read the argument |
Pick Stock Rover if you build a view from the numbers and want the deepest screener sold to individuals. Pick Seeking Alpha if you want to read why a named author likes a stock and check the case against the quant grade. Plenty of serious investors keep both: Stock Rover for the screen, Seeking Alpha for the argument.
Stock Rover vs Finviz
Finviz is the faster tool for a first pass. Its free screener runs in a browser tab with no account. The heat maps show the whole market on one screen. Each ticker page puts the chart, the ratios and the news together. The paid Elite tier adds real-time data and backtesting of screens, which Stock Rover does not offer at any price. Stock Rover wins on everything after the first pass. It has a 20-year fundamentals history where Finviz's free page shows today's snapshot. It has equation and ranked screening, research reports, and portfolio tools Finviz does not have. The usual arrangement is Finviz free for the daily scan and Stock Rover for the work that follows.
Stock Rover vs Ticker Nerd
Two answers to the same question: how much of the research do you want to do yourself? Stock Rover is for the investor who wants all the data and has the time to use it. Ticker Nerd is for the investor who wants the decisions made by rules and explained in plain English.
| Stock Rover | Ticker Nerd | |
|---|---|---|
| What you get | 800+ metrics, screens, reports and portfolio tools | The Ticker Nerd 20 — a rules-run portfolio |
| Who decides | You | Published rules over a ranked ~1,500-stock universe |
| Time it takes | Hours a week, by design | A few minutes every four weeks |
| Record | n/a — a toolkit, not a portfolio | On the join page: every trade, losers included |
| Price | From $29 a month on annual billing | $199 a year |
The short version: if you enjoy the research, Stock Rover is the best toolkit you can buy, and the trial costs nothing. If you want a system to decide the portfolio, that is what membership is. Checking the twenty names in Stock Rover's Table is a good way to use both.
Verdict: is Stock Rover worth it?
Rating: 4.5 out of 5. Stock Rover is the most thorough research tool a private investor can buy. V12 widened the gap with twenty years of fundamentals, percentile screening and a performance report that shows the return you actually earned.
The half star comes off for three things: the entry price after the 2026 repricing, the tiering that keeps the best features at $79 a month, and the no-refund policy. Against that, the trial is fourteen days of the top tier with no card. Finding out costs nothing.
Buy it if you run your own screens, read financial statements, and want professional-grade data at a retail price.
Skip it if you want picks rather than tools, invest outside North America, or research on a phone. For a lighter data need, the free plan plus StockAnalysis.com covers a great deal at $79 a year.
Related articles
Quick answers.
How much does Stock Rover cost?
Four paid tiers, checked on Stock Rover's plans page in September 2026. On annual billing: Premium $29 a month ($348 a year), Premium Plus $49 ($588), Ultimate $79 ($948) and Ultimate Pro $149 ($1,788). Month to month costs more: $34, $70, $99 and $199. Two-year billing is cheapest, at $288, $504, $828 and $1,548 a year. A free plan exists.
Is Stock Rover worth it?
Yes, if you run your own screens and read financial statements. Nothing sold to individuals matches its 800+ metrics, 20 years of history and screens you write as formulas. If you want someone else's picks or a five-minute overview, it is the wrong tool. The free plan plus a cheaper data site covers you.
Is there a free version of Stock Rover?
Yes. The free plan covers basic data on 8,500+ North American stocks, 7,000+ ETFs and 40,000 mutual funds, portfolio tracking with brokerage sync, basic charts and news. Every new account also gets a 14-day trial of the Ultimate tier with no card required.
Does the Stock Rover free trial need a credit card?
No. The 14-day trial runs on the Ultimate tier, asks for no card, and includes email support. It holds back CSV export of the Table, which is a licensing restriction, and caps research reports at 20 plus the Dow 30. Every other Ultimate feature is on. When it ends the account drops to the free plan.
Can you cancel Stock Rover and get a refund?
You can cancel at any time from Account Settings and keep access to the end of the paid period, but there is no refund. Stock Rover's FAQ calls it a strict policy: no refunds under any circumstances. Its terms say that holds even if you cancel the day after a renewal charge. Plans renew automatically. Annual and two-year members get a reminder email 45 days before renewal.
Does Stock Rover have a mobile app?
No. Stock Rover is a web app with no iOS or Android app. It runs in a phone or tablet browser (Stock Rover's stated tablet minimum is a 1024 by 768 screen), but the 45-column tables are built for a monitor.
Stock Rover or Seeking Alpha?
Stock Rover for screening and financial data: 800+ metrics, 20 years of fundamentals and screens you write as formulas, from $29 a month on annual billing. Seeking Alpha Premium, $299 a year list, for computer-scored quant ratings, contributor articles and earnings transcripts. They overlap less than their prices suggest. Many serious investors run Stock Rover for the numbers and Seeking Alpha for the argument.
The market re-ranks every week. Monday's email says what moved.
- Market Radar, every Monday: the week's biggest rank moves across ~4,600 US stocks, and the reason for each.
- The AI build-out map, free: every AI company we track, part by part, and one part in full with each verdict.