OMFOMFFinancial Services · Credit Services

OMF Stock Forecast: OneMain Holdings, Inc. Price Predictions for 2026-2027

Last close, 8 Sept 2026
$63
−2.04% on the day

The 16 Wall Street analysts covering OneMain Holdings, Inc. hold a median 12-month price target of $69 — +9.0% from the last close. Ticker Nerd's systematic factor model, run across ~4,600 US stocks, ranks it 76 of 100 as at 7 Sept 2026 — inside the top quartile. Here, the model and the Street point the same way.

Market cap
$7.4B
Ticker Nerd rank
76 / 100
Median analyst target
$69
Analysts covering
16
Revenue$1.3B+6.6% y/y
Net income$152.0M
Free cash flow$800.0M
Quarterly, 8 quarters to 30 June 2026 · latest quarter's figure shown
Total return, dividends reinvested
1W
+1.4%
1M
−0.9%
YTD
−1.2%
1Y
+11.1%
From 52W high
−6.5%
From 52W low
+33.0%
$48
$68
52-week range, adjusted closes · the dot is the last close
Ticker Nerd rank

OMF stock analysis: one number for the whole business

Consensus tells you what everyone already believes. The model scores OneMain Holdings, Inc. on its factor families — the same systematic rank behind the Ticker Nerd portfolio.

Where the model ranks itAs at 7 Sept 2026
76 / 100

Percentile across ~4,600 US stocks on Ticker Nerd’s systematic factor model. Higher is better. How the model is built and tested

Growth
83
Momentum
83
Value
80
Quality
80
Volatility
79
Issuance
61
Revisions
49
Accruals
39
Size
18

Growth (83): Sales and profits are climbing, and climbing faster than before.

Accruals (39): A large share of reported profit has not shown up as cash, or the balance sheet is expanding quickly — both tend to unwind.

Size (18): Larger than most of the companies we track — more scrutinised, less often mispriced.

Built and run by Aslam Ghouse, an ex-Goldman Sachs quant trader with fourteen years in markets.

Wall Street

OMF stock forecast 2026-2027: analyst price targets & predictions

The bullish and bearish analyst opinions on OMF, reported as data — targets and ratings, the market's view beside the model's.

Share price and the analyst range, 12 monthsAdjusted close, US dollars
$50$60$70$80$90Oct 25Jan 26Apr 26Jul 26OMFHigh $85Median $69Low $60

Price targets and ratings are third-party analyst estimates, reported here as data. They are not Ticker Nerd forecasts, and they are frequently wrong.

Data provided by Twelve Data

What Wall Street says16 analysts
10 Buy5 Hold1 Sell
Low $60Median $69High $85

The green dot is the last close — the median target sits +9.0% from it.

Recent analyst actionsNewest first

Of the 20 most recent actions, 5 moved their price target up and 2 moved it down.

DateFirmActionRatingTarget
30 July 2026CitizensMaintainsMarket Outperform$68$70
30 July 2026RBC CapitalMaintainsOutperform$70$73
30 July 2026Truist SecuritiesMaintainsBuy$70$71
7 July 2026BarclaysMaintainsEqual-Weight
7 July 2026BarclaysMaintainsEqual-Weight$61$60
7 July 2026TD CowenMaintainsBuy
7 July 2026TD CowenMaintainsBuy$66$68
6 July 2026Evercore ISI GroupMaintainsIn-Line$58$66
6 July 2026Evercore ISI GroupMaintainsIn-Line
2 July 2026Truist SecuritiesMaintainsBuy$73$70
2 July 2026Truist SecuritiesMaintainsBuy
4 May 2026BarclaysMaintainsEqual-Weight
4 May 2026RBC CapitalMaintainsOutperform
9 Apr 2026JP MorganMaintainsUnderweight
9 Apr 2026Wells FargoMaintainsEqual-Weight
6 Apr 2026BarclaysMaintainsEqual-Weight
17 Mar 2026Evercore ISI GroupMaintainsIn-Line
6 Feb 2026JP MorganMaintainsUnderweight
6 Feb 2026RBC CapitalMaintainsOutperform
6 Feb 2026Stephens & Co.MaintainsOverweight

Price targets and ratings are third-party analyst estimates, reported here as data. They are not Ticker Nerd forecasts, and they are frequently wrong.

Market Radar

This page is one stock. Monday covers all of them.

Computed off the Friday close and sent before the US open.

Market Radar reports the week’s largest rank changes across roughly 4,600 US stocks, the factor behind each one, and where the market went. OMF appears on the weeks it earns a place.

Free, every Monday. Unsubscribe any time.

Performance

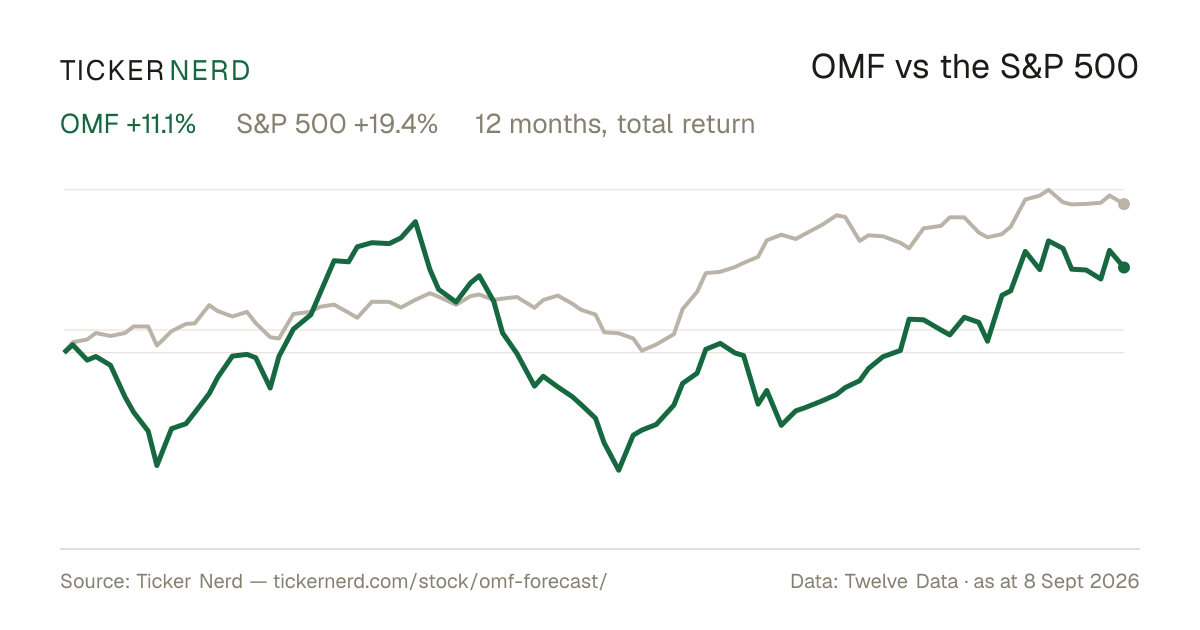
OMF vs the S&P 500

Both lines are total return — dividends reinvested — so the comparison is honest on both sides.

Over the twelve months to 8 Sept 2026, OneMain Holdings, Inc. returned +11.1% against +19.4% for the S&P 500, dividends included.

OMF vs S&P 500, last 12 monthsTotal return, rebased to 100
8090100110120Oct 25Jan 26Apr 26Jul 26OMFS&P 500

Download this chart as an image — free to reuse; link this page as the source.

Data provided by Twelve Data

Estimates

OMF analyst estimate revisions

Not the forecast itself — the direction analysts are revising it. Revision direction is one of the model's factor families.

Which way the estimates are movingNext fiscal year
EPS revision, 90 days
−2.8%
Analysts raising
6
Analysts cutting
8
Fundamentals

OneMain Holdings, Inc. (OMF) financial data

A margin means little on its own. Each bar marks where the figure sits across the whole US universe we score.

Valuation
Trailing P/E
9.7×

Cheaper than 60% of US stocks

Price / sales
2.4×

Cheaper than 48% of US stocks

Price / book
2.2×

Cheaper than 43% of US stocks

EV / EBITDA
Growth & margins
Revenue growth (YoY)
−2.7%

Higher than 23% of US stocks

Earnings growth (YoY)
−9.0%

Higher than 27% of US stocks

Gross margin
Operating margin
28.6%

Higher than 86% of US stocks

Net margin
25.9%

Higher than 86% of US stocks

Returns & dividend
Return on equity
23.3%

Higher than 84% of US stocks

Return on assets
2.9%

Higher than 64% of US stocks

Dividend yield
6.6%

Higher than 87% of US dividend payers

Bars mark the percentile across the ~4,600 US stocks Ticker Nerd covers, among those reporting the figure.

Key statistics

OneMain Holdings, Inc. (OMF) statistics: revenue, profit & scale

The headline figures, each with its date. Every row carries its own link — cite it straight from here.

  • OneMain Holdings, Inc. has a market value of $7.4B and an enterprise value of $29.6B.

  • Revenue in the twelve months to 30 June 2026: $5.1B. The latest quarter shrank 2.7% year on year.

  • Net income over the same four quarters: $781.0M, a 15.2% net margin.

  • Diluted earnings per share, trailing twelve months: $6.64.

  • Free cash flow in the twelve months to 30 June 2026: $3.2B.

  • OneMain Holdings, Inc. spent $243.0M on share buybacks and $498.0M on dividends in the twelve months to 30 June 2026.

  • Shares outstanding: 115.1M.

  • Trailing P/E: 9.7×; forward P/E: 7.5× — the forward figure prices analyst consensus estimates, not reported earnings.

  • Forward dividend yield: 6.56%, paying out 63% of earnings.

  • OneMain Holdings, Inc. employs 9,300 people $551K of revenue per employee.

Statement figures: company filings via Twelve Data, four quarters to 30 June 2026 · market figures as at 8 Sept 2026

Data provided by Twelve Data

Peers

OMF vs competitors

The nearest names by industry and size, scored by the same model — like for like.

Its peer group, ranked by the same modelCredit Services
CompanyMarket capTKN rank
OMFOneMain Holdings, Inc.$7.4B
76
CACCCredit Acceptance Corp.$6.3B
86
FCFSFirstCash Holdings, Inc.$9.9B
74
ENVAEnova International, Inc.$5.8B
86
SLMSLM Corp.$5.1B
93
NNINelnet, Inc.$4.6B
59
BFHBread Financial Holdings, Inc.$4.5B
98

Look up any of the roughly 4,600 stocks we score.

The rank is the raw material. Whether the rules would actually own OneMain Holdings, Inc. — and when they’d sell — is the membership. See the Ticker Nerd 20 →

News

Latest OMF news & analysis

OneMain Holdings to Present at Barclays Global Financial Services Conference

PRNewsWire · 8 Sept 2026neutral

OneMain Holdings announced that CFO Jenny Osterhout will present at the Barclays 24th Annual Global Financial Services Conference at 10:30 a.m. on September 8, 2026. The company, which offers nonprime consumers responsible access to credit, disclosed the upcoming conference participation via press release.

Why it matters — The presentation gives OMF watchers an opportunity to hear from the CFO at a major industry conference, which could offer insight into the company's position among financial services peers.

OneMain Holdings: Well Positioned Given Tightened Credit Standards (Downgrade)

Seeking Alpha · 26 Aug 2026neutral

OneMain Holdings received a rating adjustment to "Buy" in a Seeking Alpha analysis, which cites tighter credit standards and a resilient labor market as supporting stable performance. The report highlights risk mitigation including a stress overlay, a shrinking back book, and improved delinquency and charge-off trends, alongside loan growth and balance-sheet strength.

Why it matters — A OneMain watcher would care because the update touches on credit quality, loan growth, and dividend security—key factors shaping the company's near-term outlook.

KBRA Assigns Preliminary Ratings to OneMain Financial Issuance Trust 2026-3

Business Wire · 5 Aug 2026neutral

KBRA assigned preliminary ratings to four classes of notes issued by OneMain Financial Issuance Trust 2026-3, a consumer loan asset-backed securitization totaling $600.0 million. The ratings reflect initial credit enhancement levels ranging from 33.10% for the Class A notes to 10.80% for the Class D notes.

Why it matters — OMF watchers track this because the preliminary ratings on the company's consumer loan ABS issuance provide visibility into the credit quality and structure of its ongoing securitization funding.

KBRA Assigns Preliminary Ratings to OneMain Financial Issuance Trust 2026-2

Business Wire · 5 Aug 2026neutral

KBRA assigned preliminary ratings to four classes of notes issued by OneMain Financial Issuance Trust 2026-2 (OMFIT 2026-2), a consumer loan asset-backed securities transaction totaling $750 million. The preliminary ratings reflect initial credit enhancement levels ranging from 32.75% for the Class A notes to 10.45% for the Class D notes, comprised of overcollateralization and subordination of junior note classes.

Why it matters — OMF watchers would care because this indicates the company is continuing to access the ABS market to fund its consumer loan originations.

Yes, Safe 6% Dividend Yields Do Exist. Here Are 5 You Can Buy Right Now

24/7 Wall Street · 5 Aug 2026neutral

An article from 24/7 Wall Street notes that with the 10-year Treasury yielding 4.70%, income investors can find dividend yields around 6% without accepting junk-level risk, and it lists five such stocks to buy now.

Why it matters — OMF watchers would care because the piece highlights that high-yield dividend stocks remain attractive to income investors in the current rate environment, though OMF itself is not named in the excerpt.

FAQ

Frequently asked questions about OMF stock

What is the OMF stock price forecast for 2026-2027?

The 16 Wall Street analysts covering OneMain Holdings, Inc. have a median 12-month price target of $69, with estimates ranging from $60 to $85. These are third-party analyst estimates, not Ticker Nerd forecasts, and they are frequently wrong.

Is OMF stock a buy right now?

Of the 16 analysts covering OneMain Holdings, Inc., 10 rate it a Buy, 5 a Hold and 1 a Sell. Ticker Nerd's systematic factor model ranks OneMain Holdings, Inc. 76 out of 100 across roughly 4,600 US stocks as at 7 Sept 2026. None of this is personal advice — it does not consider your circumstances.

How does Ticker Nerd's model rank OMF?

As at 7 Sept 2026, OneMain Holdings, Inc. ranks 76 out of 100 on Ticker Nerd's systematic factor model — a percentile across roughly 4,600 US stocks, built from its factor families. Its strongest factor family is Growth (83 of 100).

Will OMF stock go up?

No one can know that. What the data says: the median 12-month target from 16 analysts implies +9.0% from the last close, and Ticker Nerd's factor model ranks OneMain Holdings, Inc. 76 out of 100 as at 7 Sept 2026. Analyst targets are third-party estimates and frequently wrong; none of this is personal advice.

What is the OMF stock forecast for 2030?

No analyst covering OneMain Holdings, Inc. publishes a 2030 price target — Wall Street targets run 12 to 18 months out. Sites quoting a 2030 price for OMF are extrapolating price history, which says nothing about the business. The furthest attributed numbers are the current analyst targets: $60 to $85 over the next 12 months.

How has OMF stock performed over the past year?

OneMain Holdings, Inc. returned +11.1% over the 12 months to 8 Sept 2026, with dividends reinvested. Past performance does not indicate future returns.

What does OneMain Holdings, Inc. do?

OneMain Holdings, Inc. is a consumer finance company that provides personal loans, auto financing, and credit card products to nonprime customers across the United States.

What is the latest news on OMF?

The most recent item we track (PRNewsWire, 8 Sept 2026): "OneMain Holdings to Present at Barclays Global Financial Services Conference". OneMain Holdings announced that CFO Jenny Osterhout will present at the Barclays 24th Annual Global Financial Services Conference at 10:30 a.m. on September 8, 2026. The company, which offers nonprime consumers responsible access to credit, disclosed the upcoming conference participation via press release.

Company

About OneMain Holdings, Inc.

OneMain Holdings, Inc. is a consumer finance company that provides personal loans, auto financing, and credit card products to nonprime customers across the United States. The company originates, underwrites, and services secured and unsecured loans through a combination of branch locations, centralized operations, digital channels, and its website. Its offerings also include optional credit insurance, non-credit insurance, guaranteed asset protection coverage, and membership plans, supporting customers who are seeking flexible borrowing options and related financial protection products. OneMain Holdings, Inc. operates primarily through its Consumer and Insurance segment, which is central to its lending and insurance activities. Headquartered in Evansville, Indiana, the company plays a significant role in the specialty consumer lending market by serving borrowers who may have limited access to traditional bank credit.

CEO Mr. Douglas H. Shulman J.D. · 9,300 employees · United States · https://www.onemainfinancial.com